
M&A Recovery Right Around the Corner
Sponsors and Strategics Set to Capitalize on Market Tailwinds
We continue to expect a meaningful rebound in the M&A market during 2024 despite global deal counts remaining subdued in Q1. Activity recently strengthened in key market segments, reinforcing our confidence that a broad-based recovery will begin soon. Our prediction of better M&A market performance is also based on increasingly constructive fundamentals for deal activity plus encouraging indicators from Baird’s current sellside processes. Based on the usual cycle of six-plus months from M&A advisor mandate to transaction signing, we anticipate a larger ramp-up for deal announcements in H2 2024. In this piece, we discuss the implications of improving dynamics for financial sponsors as well as corporates, with both groups looking to make up for lost time in the M&A market.
| 2023 Summary | 2024 Update |
| M&A market weakness amid valuation gap, increased rates | Good Q1 for leading indicators: large deals, PE exits, Baird processes |
| Mega deal activity hit by economic concerns, financing challenges | Pickup in $1B+ deals on stronger debt markets, pent-up demand |
| PE selling at 10-year low; sale plans delayed due to lower multiples | Q1: most exits since 2022 with better backdrop for pent-up supply |
| Leverage reduced on higher rates and bank lender caution | Lenders hungry for deals; cost of debt below 2023 peaks |
| Bid-ask M&A valuation gap from lower leverage, macro concerns | Valuation gap narrowing with leverage upturn, reduced spreads |
| PE buying down on challenges around financing, exits, fundraising | More deployment capacity at lower rates and as realizations rise |
| Strategic M&A hurt by economic uncertainty and volatility | Corporate buying to strengthen with confidence firming per surveys |
Leading Indicators Have Turned Positive
Based on our evaluation of past cycles, deal metrics for (1) M&A transactions with disclosed value of $1+ billion and (2) financial sponsor M&A exits represent effective leading indicators of a forthcoming upturn in the broader M&A market. These ranked as the top two for deal count growth among all segments during the periods shown below (topping corporate acquisitions/divestitures, sponsor platforms/add-ons, cross-border M&A, public company targets, and smaller deals), supporting our confidence in their value for signaling better M&A trends. In each case, the 12 months following these periods included substantial acceleration in M&A activity (as detailed in the Historical Patterns section).
Average Monthly Deal Counts for Last 3 Months of M&A Downturn vs. Prior 12 Months
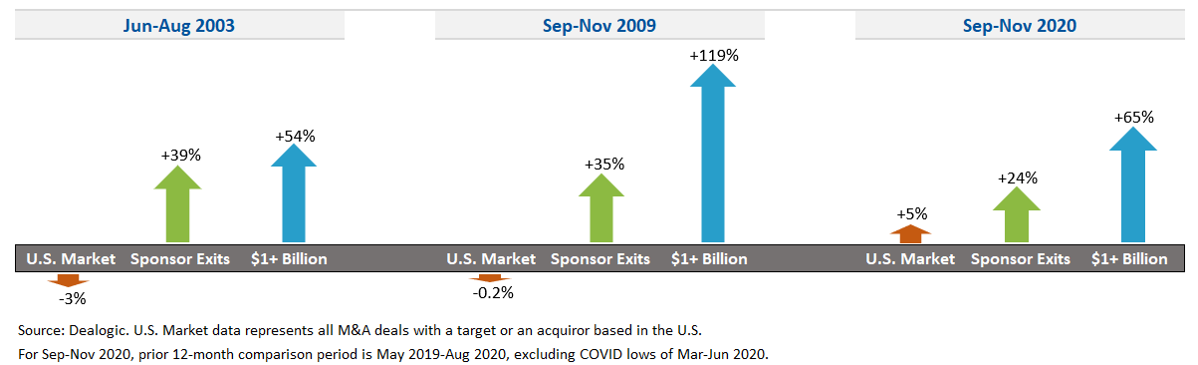
While we believe the insights presented here are highly relevant to M&A in large markets such as Europe and Asia, our analysis focuses on the U.S. due to its leading contribution to the global M&A market (at 56% of disclosed deal value over the past decade). In addition, the U.S. M&A market typically led other geographies during prior recoveries by one to two quarters based on deal count data relative to activity elsewhere.
Q1 2024 showed the same pockets of strength as the previous M&A cycles highlighted above, underscoring the potential start of a wide-ranging recovery in the M&A markets over the balance of this year and beyond.
Recent Gains for Large Deals
Large deal activity far outpaced overall M&A in the first quarter of 2024, suggesting a potential upturn across the market in the upcoming period.
- In Q1 2024, the number of $1+ billion U.S. deals was 20% above the quarterly average of 2023.
- This level of growth compared favorably to contraction in the overall U.S. M&A market, where the transaction count for Q1 was an estimated 8% below the average of 2023 (including adjustments for expected data revisions in this and most other segments presented).
- In addition, the disclosed deal value for $1+ billion deals in Q1 exceeded the quarterly average of last year by 40%.
During past M&A cycles, a wave of deals with disclosed values of $1+ billion occurred soon before improvement in the overall market in subsequent months. At the end of past downcycles, both strategic and sponsor buyers were ready to act on larger, coveted assets once sensing a more competitive M&A environment. We see the return to growth for bigger transactions as a positive sign of rising confidence levels among buyers and clearer visibility for the financial performance of targets, pointing to additional deal making on a widespread basis.
Sponsor Selling a Positive Signal
After stabilizing at low levels in the back half of 2023, PE sellside activity moved higher during Q1 2024.
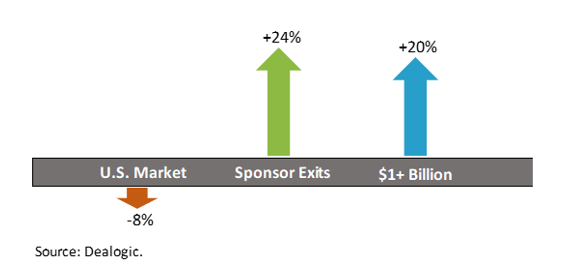
- In the first quarter of the year, the estimated transaction count for U.S. sponsor M&A exits was 24% above the quarterly mean for 2023.
- This represents 32 percentage points of outperformance relative to the 8% decline in the U.S. M&A market over the same period (as noted above)
- The gap of 32 percentage points matches the average for this metric in the three historical cases detailed in the first chart.
Average Monthly Deal Counts for Q1 2024 vs. Full Year 2023
A closer look at the rationale behind financial sponsor exits as a leading indicator is also warranted. The number of sponsor M&A exits moved significantly higher toward the end of the previous downturns, when PE firms prioritized selling existing portfolio companies to deliver distributions to LPs and to enhance the success of raising the next fund. Accordingly, the prospects of healthier conditions ahead caused PE firms to re-engage on many previously delayed sale processes. A pickup in sponsor exits also suggested a better balance for valuation perspectives among sellers and buyers, a critical precursor for an extensive recovery.
Historical Patterns Encouraging
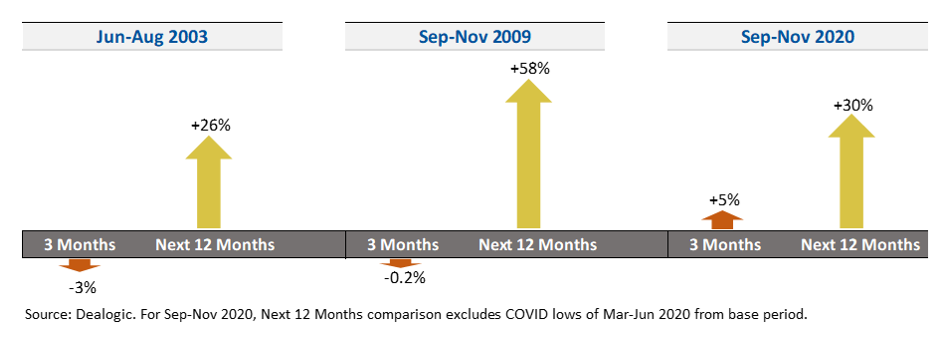
While acknowledging that the eventual M&A rebound will vary from prior scenarios, U.S. M&A market results in the first year following the periods summarized above were highly positive.
- Over the first 12 months of these three M&A upturns, deal count increases ranged from 26% to 58% and averaged 38%.
- In addition, our 2024 M&A outlook noted a related historical trend in which the last three occurrences of two consecutive years with transaction declines (as seen in 2022-2023) were followed by years with deal growth averaging 13%.
U.S. M&A Market Last 3 Months of Downturn & Next 12 Months
The potential for historical patterns to repeat seems high in view of the improvement in macroeconomic conditions relative to the heightened volatility and uncertainty of the last two years.
- With initial U.S. Federal Reserve rate decreases anticipated during 2024, M&A appetites are expanding after substantial central bank hikes resulted in a risk-off approach for much of 2022-2023. However, near-term benefits from Fed rate cuts seem somewhat diminished by these likely occurring on a later timeline and at a slower pace than expected at the start of the year.
- Greater buyer demand should reflect rising confidence in corporate and investor boardrooms as public equity markets reach new highs and as recessionary forces recede in many sectors, particularly in the U.S.
- The clearer near-term outlook enhances the credibility of the 2024 EBITDA forecasts of prospective targets, promoting alignment on valuation among buyers and sellers.
Implications of Market Dynamics for Financial Sponsor M&A
PE Sellers Becoming More Aggressive
The relative strength of sponsor M&A exits in Q1 should represent the beginning of an extended wave of realizations for the pent-up supply of portfolio companies. Factors supporting this thesis include the need for liquidity events to support future fundraising, stronger financing markets, and building momentum for activity around Baird M&A sellside advisory engagements.
Accelerating the pace of distributions to LPs is a high priority for many PE firms, particularly those seeking to raise new funds in the near term.
- On a global basis during 2023, financial sponsors experienced a 31% decline in the number of M&A exits, which fell to a 10-year low despite the number of portfolio holdings rising about 70% over the past 10 years.
- The level of buyout fund distributions in 2023 was only 11% of net asset value at the start of the period; this represented the lowest percentage in 14 years and was less than half of the 28% average for 2013-2022, illustrating the large upside potential for sponsor selling over a multi-year period.
- Improved market conditions should support substantial growth in distributions by enabling sponsors to expand M&A exits beyond the highest-quality portfolio companies.
- Distributions should also benefit from more GPs evaluating the LP liquidity potential of continuation vehicles as well as the increased viability of recapitalizations amid lower financing rates.
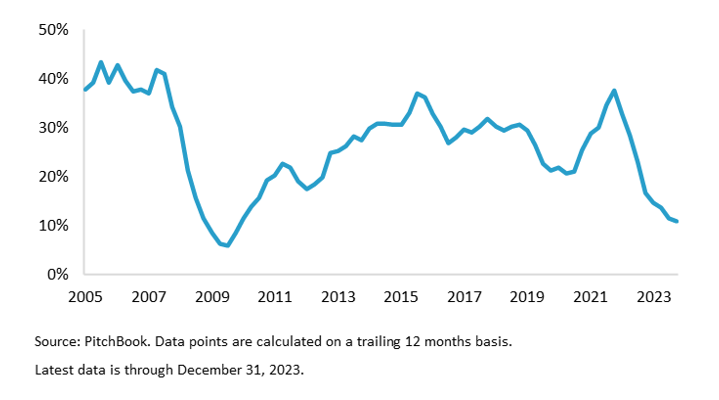
Buyout Fund Distributions as % of Beginning NAV
Strengthening in the leveraged finance markets should lead to more market clearing offers for recently launched (or re-launched) processes.
- During 2023, the higher cost of debt resulted in lower LBO valuations, causing many sponsors to delay or defer planned sales.
- Conditions in the debt markets have improved since the start of 2024, as indicated by a substantial rebound in the public market and tighter pricing across markets; renewed strength in the broadly-syndicated markets is putting pressure on private credit to get more competitive on terms.
- Spreads that have narrowed to multi-year lows in the U.S. are beginning to support higher leverage ratios (5.1x in Q1 vs. 4.9x in 2023) on U.S. LBOs (per PitchBook LCD), with the corresponding lift to valuations likely to push more deals across the goal line in the upcoming period.
Our confidence in building momentum in the M&A market is also based on notable recent increases in the pre-signing activity within Baird’s Global Investment Banking business, as well as buyer behavior in our sellside advisory processes. During Q1:
- The number of pitches reached a seven-quarter high and was 25% above the Q1 2023 figure.
- Our backlog of current M&A engagements ended the quarter 23% higher than the March 2023 level.
- The number of marketing launches for sellsides increased 27% from the Q1 2023 total.
Encouraging process data should translate to growth for deal signings in view of buyer behavior in our recent sponsor sellsides, with positive signs including increases in the number of IOIs and final bidders as well as greater success with bridging bid-ask spreads via negotiations and structuring. Given the typical cycle of six-plus months from M&A advisor mandate to deal signing, we expect a stronger uplift in transaction announcements in the second half of 2024.
We believe PE firms contemplating liquidity events for holdings should evaluate timing with a greater degree of urgency on planned transactions.
- As more assets enter the market, the capacity of some buyers could become constrained in the U.S., a condition potentially exacerbated by a more widespread rush to the exits once the Fed starts cutting rates.
- The ramp in pitch volumes and mandates in Q1 ties into expectations that Q2 and Q3 could be a more challenging period for resource allocation among buyers.
- In the U.S., the M&A market may become crowded by some processes targeting completion ahead of the Presidential election in November.
- Options for achieving liquidity for LPs include M&A exits, continuation vehicles (which are gaining share as more GPs move up the learning curve for this deal type), dividend recaps (supported by accessible financing markets), and IPOs (as the window opens wider amid equity market strength).
- The factors noted just above appear less applicable over the near term in Europe, where some PE firms are expecting a fuller recovery in 2025.
Sponsor Buyers Ready for Deployment
We expect PE firms to become more active buyers over the course of 2024 following the continuation of limited acquisition activity through Q1. Although the number of acquisitions with PE buyers declined an estimated 20% year over year in the first quarter of 2024, we are seeing pent-up demand emerging under the surface in our sellside processes. Several factors support a sustained period of additional sponsor buying, including improved financing markets, further growth in dry powder to fund platform deals, and an increasingly strategic approach to sizeable add-on acquisitions for portfolio holdings.
Financial sponsors are likely to lean into to capital deployment mode after a stretch of largely staying on the sidelines amid higher financing costs.
- The financing markets have recently tilted in favor of sponsor borrowers in view of resurgent activity in the public markets (where Q1 loan volume more than doubled to a nine-quarter high) along with direct lenders being flush with capital after continued strength in fundraising.
- The buying environment over the balance of the year should be more constructive based on reduced pricing and higher leverage, with borrower terms to be supported further by upcoming central bank rate cuts.
PE firms have the means to capture larger platform targets due to public and private lenders being hungry for deals as well as access to increased levels of unused committed capital.
- The ability to undertake larger acquisitions was evident in Q1, when sponsors announced the second-most $1+ billion LBOs in the past six quarters.
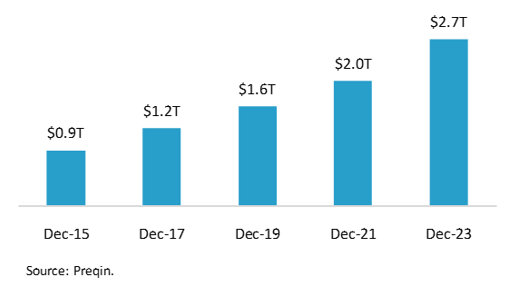
- The buying capacity of PE firms is massive given the 33% growth in global dry powder over just the past two years, climbing to $2.7 trillion (across all forms of private equity) at the end of 2023.
Global PE Dry Powder
In terms of PE buyer behavior, we note that:
- PE-backed portfolio companies have been more strategic in their appetite for synergistic M&A. According to PitchBook, add-on activity in 2023 accounted for a near record 72% of private equity buyouts in the U.S. and Europe.
- We are seeing more aggressive approaches from sponsor buyers in many of our sellside processes, especially among those recently raising funds.
- A subset of PE firms has been less active due to fundraising challenges, which should be alleviated as exits accelerate.
Impact of Market Drivers on Corporate M&A Activity
Strategic Buyers Well Positioned
Even as competition from sponsor buyers intensifies, we anticipate robust corporate acquisition activity over the course of 2024. In Q1, the number of strategic acquisitions decreased an estimated 13% year over year, with strength in the $1+ billion segment outweighed by contraction in the middle market. Drivers of a future uptrend in this category include better macroeconomic conditions, higher public equity values, knock-on effects from larger deals, and mounting cash positions.
Increased expectations for economic growth and added confidence among leadership teams have enabled more corporates to closely evaluate and, in many cases, execute on major deals.
- Relative to six months ago, macro research firm Strategas (part of Baird since 2018) has raised its U.S. GDP growth forecast for 2024 from 1% to 2%.
- During Q1, the Conference Board announced that its Measure of CEO Confidence reached the highest level in two years, reflecting a favorable view on a net basis for the first time since Q1 2022.
- In late Q1, a quarterly survey of CFOs (conducted by Duke University and two regional Federal Reserve banks) indicated the most optimism in the U.S. economy since Q2 2021 as well as an eight-quarter high for confidence in the financial prospects of their firms.
Strategic buyer behavior in our processes suggests rising confidence from management teams.
- In 2024, our signed advisory deals experienced participation from more corporate acquirors at all stages – IOI, update bid, final bid – in comparison to 2022-2023.
- With more assets now available in the market, a proactive approach is warranted from corporates seeking to evolve their portfolios via M&A to gain exposure to secular growth themes.
Within the larger deal segment, transformational deals could become a catalyst for increased M&A activity in certain sectors.
- On a global basis, Q1 included 14 $10+ billion deal announcements, the highest quarterly total since Q3 2021 and the fourth-most ever in a single quarter.
- We have observed that $10+ billion transaction announcements frequently have potent downstream effects within industries, including corporate carve-outs as well as deals undertaken by competitors in response.
Many corporates have the financial capacity to undertake acquisitions in view of immense cash balances with near-term potential to rise further.
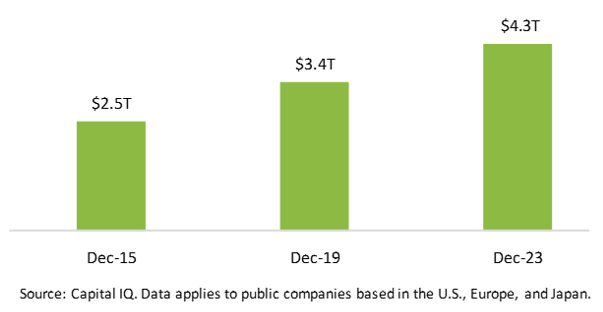
- After year-end 2023 reporting, balance sheet cash reached $4.3 trillion for publicly traded companies (excluding the finance sector) based in the U.S., Europe, or Japan (home to acquirors for nearly 70% of M&A over the past 10 years), up from $2.5 trillion eight years earlier.
- Continued growth in corporate earnings should contribute further to the large cash pile, as EBITDA growth for the S&P 500 is estimated at 13% in 2024, with an increase of 11% projected for 2025.
Major Market Public Company Cash Balances
Increased stock prices since the start of 2023 bode well for future corporate M&A.
- The buying capacity of public companies is being boosted by higher equity values as corporate outlooks reflect subsiding recession risks. Indeed, this factor appears to have contributed to the pickup in large deals, as public company stock was a component of consideration in 43% of $1+ billion transactions on a global basis in Q1, up from 40% in 2022-2023.
- Strong performance in the equity markets often is a leading indicator of increased M&A activity, with market rallies (as seen in 2023) often reflecting the increased management confidence needed for the M&A market to improve. The 2003-2022 period included seven years when the return for the S&P 500 exceeded 16%. During those seven years, the number of U.S. M&A transactions was near flat on average, whereas deal counts rose an average of 15% in the following years, supporting an upbeat thesis for 2024.
Corporate Sellers a Key Source of Targets
Corporates are likely to feed into the M&A market recovery through a pickup in divestitures along with continuation of strength in take-private transactions for companies with lagging stock valuations.
After delaying asset sales amid challenging M&A market conditions, corporates should be poised to pursue portfolio rationalization due to more sponsor and strategic buyers being on the hunt for targets.
- Corporate selling is critical to the supply side of the M&A equation, with public company divestitures (excluding listed sponsors) representing 18% of all global M&A activity over the past 10 years.
- Public company divestiture activity remained weak in Q1 after falling to a 27-year low and accounting for only 14% of transactions on a global basis during 2023.
- Public companies increase the likelihood of encountering activist investors if viewed as misallocating capital, often from not reshaping their asset portfolios to align with secular growth themes.
Corporates also could become a bigger source of targets in 2024 through public-to-private transactions, which have been increasingly prominent in the M&A market over the last year-plus.
- Activists could play a leading role here as well by pushing for company sales, which would be enabled by stronger LBO fundamentals.
- The deep pool of take-private candidates includes a large portion of the 1,500+ companies that came public in the U.S. during 2020-2021, as many of these are trading below their IPO prices.
We are seeing a return to broader auction processes across the M&A market as sellers are more willing to engage with a wider pool of viable buyers. Despite our positive stance, we recognize that headwinds remain, including still elevated financing costs, a stricter regulatory environment in the U.S., and uncertainty related to U.S. elections in November. However, since an “all clear” signal will never arrive, we encourage buyers and sellers to execute on M&A strategies with a sense of urgency given the potential for market crowding later in the year amid accelerated deal flow. Please contact Baird’s Global M&A team to discuss your transaction plans.