Operating In a Trough: H1 2023 Review of European PE Activity
Expected pickup in sale process launches by the end of 2023 signals that we are getting ready for the next M&A cycle
- The number and value of European PE investments fell by 65% and 80% respectively in H1 2023 vs. H1 2022
- Average LBO valuation decreased to 9.6x EBITDA in H1 2023 as the M&A valuation gap (bid-ask spread between potential buyers and sellers) continues to narrow, primarily due to more realistic seller valuation expectations
- UK and DACH account for almost half of PE investment activity – DACH’s 22% share in H1 2023 is a new record
- Record high shares of 57% for Services and Software & Technology and 30% for Industrial PE deployment
- Preference for mid-market given availability of debt financing – less than ten €1bn+ PE investments in H1 2023
- Public debt markets are open and pricing has stabilised, but lenders remain selective, shying away from cyclicality
- PE exit activity likely at a trough with deal count and value down 60% and 70% respectively in H1 2023 vs. H1 2022
- While PE-backed IPOs remain at low levels, P2P (public-to-private) deals have continued given attractive valuations
- Difficult fundraising environment as LPs (limited partners) focus their allocations on the most successful GPs
- Robust buy-and-build activity in H1 2023 – focus on EBITDA growth (rather than multiple expansion) to create value
- US already seeing an acceleration in M&A process launches – Europe could follow with a lag of one or two quarters
- Strong M&A backlog and scale of today’s European PE industry, both in terms of supply (number of PE portfolio companies) and demand (record $289bn of buyout dry powder), could drive a recovery in M&A activity in 2024
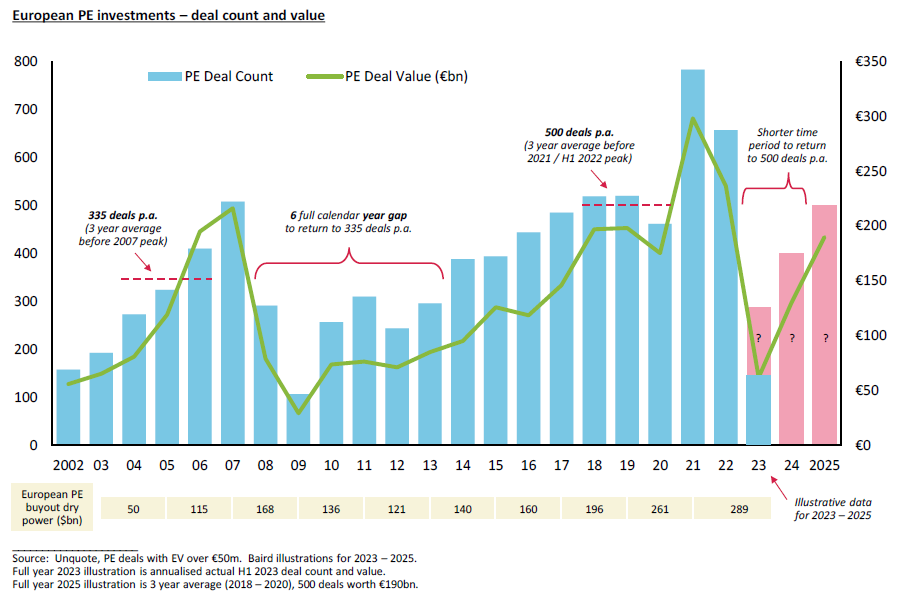
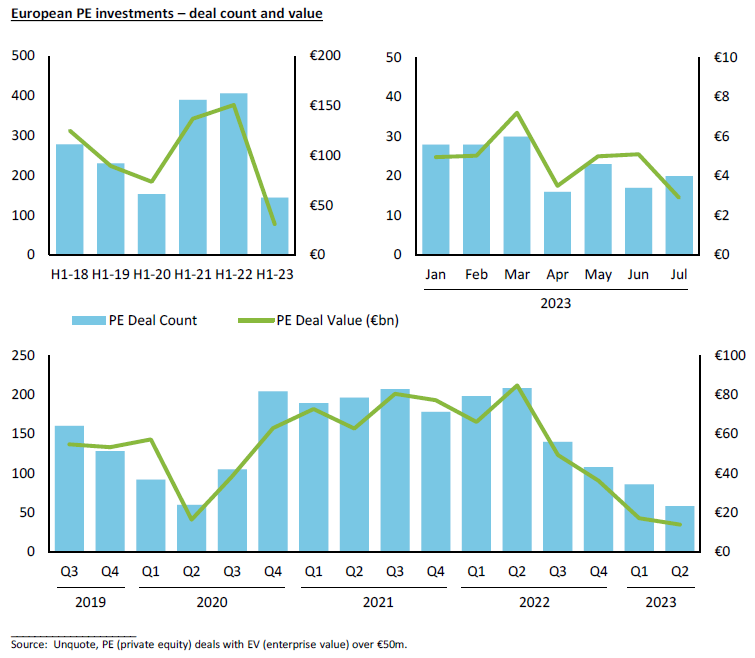
PE deployment fell 65% in H1 2023, representing the lowest half year in over a decade
European PE activity (for investments over €50m in enterprise value) has likely reached its trough in H1 2023 with deal count and value down 65% and 80% respectively compared to H1 2022. We see this period as one of transition for private equity as they adapt to a more normalised level of interest rates, above-target inflation and lower risk tolerance in a recessionary environment. While the M&A and debt markets are open, PE deployment has been impacted by:
- 10%+ cost of debt, lower leverage levels and consequently valuation levels being put forward by PE bidders
- Flight to quality – higher dropout rates from lenders and PE buyers for any assets that are perceived to be cyclical
- Use of dry powder on buy-and-build activity with lower average valuation levels instead of new platform investments
- PE firms facing more scrutiny from constituencies (ICs, LPs), making it difficult to build consensus around a target
- High proportion of sale processes that are mandated to an M&A advisor, but have not yet launched in the market
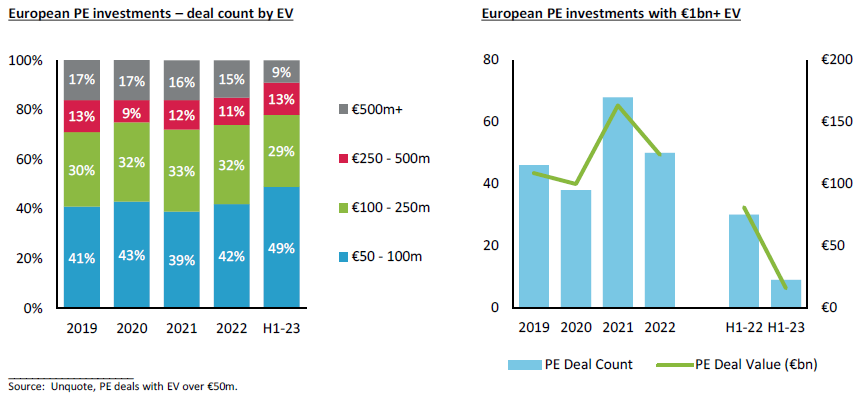
Preference for mid-market – less than ten €1bn+ PE investments in H1 2023
H1 2023 saw a preference for mid-market PE deals given the higher availability of debt financing for credits with €10 – 50m EBITDA. As such, the share of deals with an EV over €500m fell to below 10% as large-cap sponsors struggled to find appropriate debt financing for many “B” grade assets amid a higher interest rate, risk-off environment. There were less than ten €1bn+ PE investments in H1 2023, all “A” grade companies demonstrating resilience and growth as well as strong and predictable cash flows (e.g. Permira’s acquisition of Acuity Knowledge Partners, a global tech-enabled provider of research, analytics and business intelligence to the financial services sector).
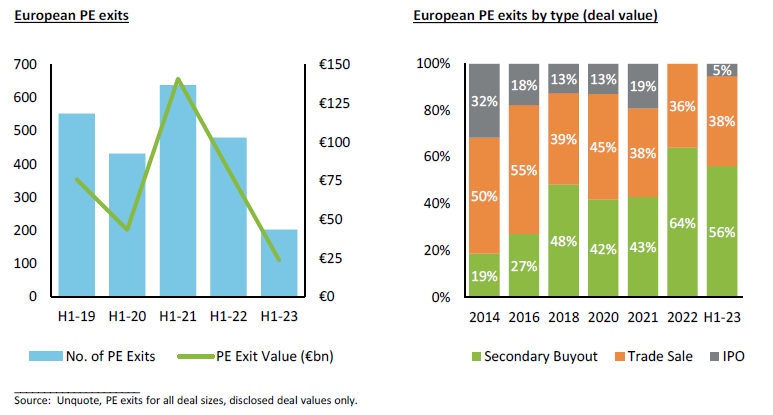
PE exits down 60% in H1 2023 – select trade sales continue at high valuations
Similar to sponsor deployment, European PE exit activity (for all deal sizes) has likely reached its trough in H1 2023 with deal count and disclosed deal value down 60% and 70% respectively compared to H1 2022, driven by:
- General reluctance of PE vendors to launch into the M&A market, waiting for macro clarity (e.g. consumer sentiment, inflation), the financing market and / or perception of stronger appetite from potential buyers
- M&A valuation gap between sellers and buyers, though we have seen a converging trend since Q2 2023
- Portfolio companies building a “clean” financial track record e.g. 12 months of financials after Covid dip / bump
Secondary buyouts continued to account for over 50% of European PE exits by disclosed deal value. Cash-rich strategic acquirers, not dependent on debt financing, have benefitted from lower PE competition, both in terms of their value and speed. A number of Baird’s “strategic-only” cross-border M&A processes led to high valuation outcomes, particularly in the Industrial sector (e.g. sale of ARAG in Italy to Nordson in the US, sale of Distrelec in Germany to RS Group plc in the UK). With just one PE-backed IPO exit (EuroGroup Laminations in Italy) in the last 18 months, some portfolio companies that had initially planned for an IPO exit chose to sell to a strategic buyer or another PE firm. We expect this to change over the next 18 months as the IPO market continues to show signs of opening, led by the US.
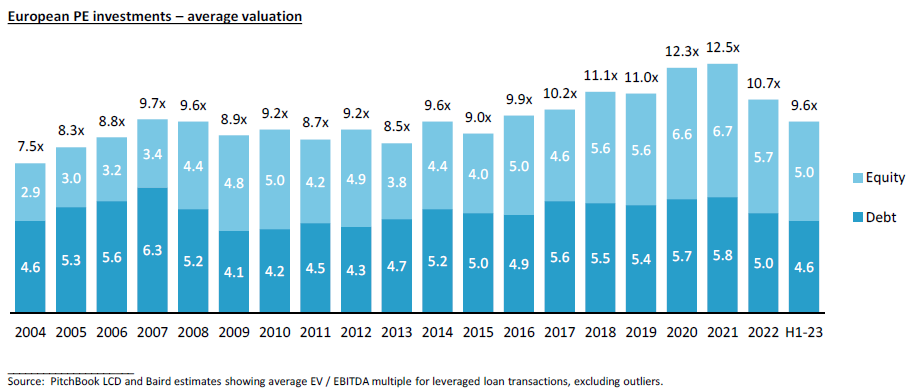
Average LBO valuation decreased to 9.6x EBITDA in H1 2023 as the M&A valuation gap continues to narrow
European LBOs were completed at a lower average valuation in H1 2023, reflecting higher interest rates, lower leverage levels, more conservative business plans, downward revisions in assumed exit multiples and more realistic valuation expectations from vendors. This closer valuation alignment among buyers and sellers across a broad base of sectors is integral to any future M&A market recovery. Having said this, valuation levels for top-quartile inflation-resilient assets remain elevated given the continued “flight to quality” from PE buyers.
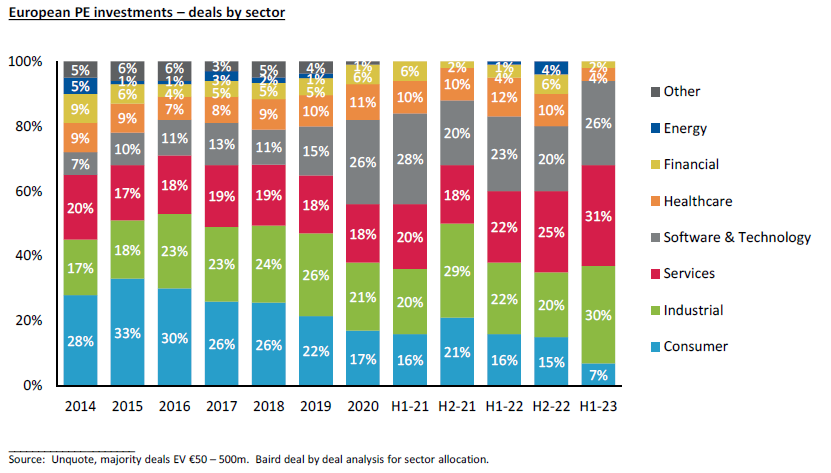
Unique sector mix in H1 2023 with record highs and record lows
For the first time, the combined share of the Services and Software & Technology sectors accounted for the majority of PE investment activity by deal count in H1 2023 at 57%. Also for the first time, Consumer contributed its lowest share of PE activity at 7%, a stark contrast to its leading position of 30% in 2016. Despite being a resilient sector, Healthcare activity was also at a record low, accounting for less than half of its usual share at 4%.
The Industrial sector reached a record high of 30% in Europe in H1 2023. PE firms have a robust appetite for recession-resilient Industrial subsectors (e.g. packaging) and companies supported by secular growth themes (e.g. automation, electrification, safety). We have seen a meaningful recovery in Industrial sell-side pitches and process launches in H1 2023 as global supply chains, as well as energy prices, normalise and inflation starts to come down.
For further commentary on sector trends, please read our article: Which sectors did PE invest in during H1 2023?
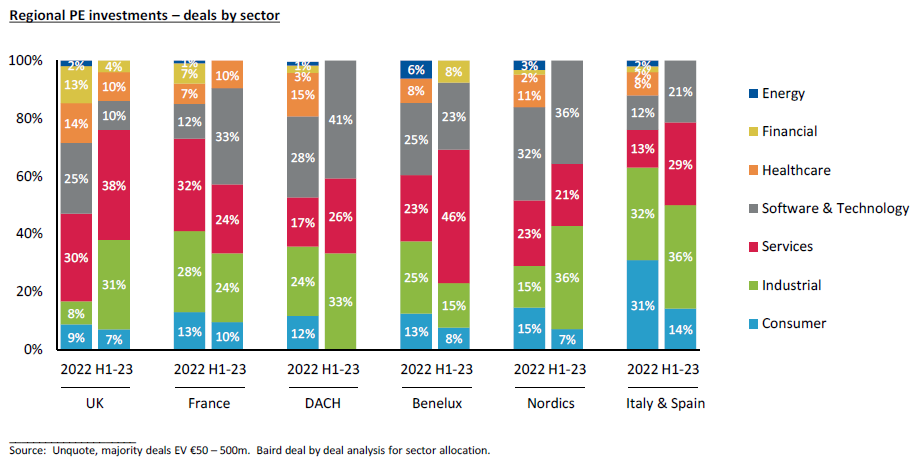
Sector mix varies significantly by region
The UK and Benelux have the highest share of Services PE deals, while DACH, France and the Nordics have the highest share of Software & Technology transactions in H1 2023. FIRE (facility, industrial, residential & environmental) was the most active subsector within Services, covering a vast array of non-deferrable onsite services. PE appetite for highly cash generative software companies remains strong post Covid, particularly for vertical software (e.g. education, healthcare) where the go-to-market efficiency is typically higher than horizontal software.
With just a handful of European Healthcare deals, and two healthcare software deals in DACH and the Netherlands (classified under Software & Technology), there were no mid-market PE Healthcare investments across the Nordics, Italy and Spain in H1 2023. Vendors of top quartile Healthcare assets have high valuation expectations and often little urgency to come to market given the resilience of most Healthcare end-markets. However, we are now seeing certain vendors start to mandate M&A advisors, suggesting that the Healthcare M&A pipeline for 2024 is building.
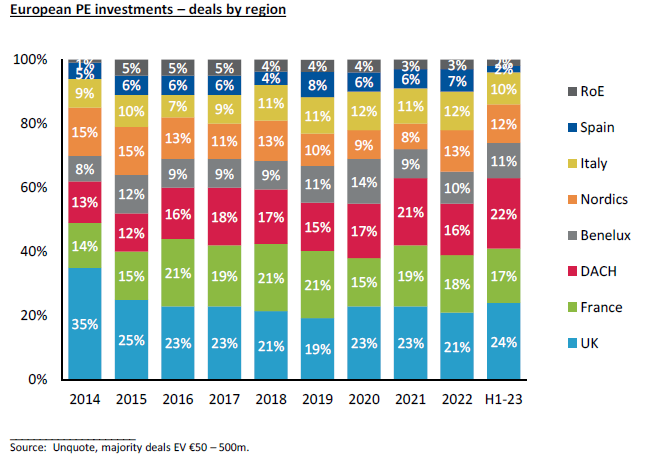
UK and DACH account for almost half of the PE market
Every region saw decreased PE deal activity in H1 2023. The UK remains the most active PE investment region by deal count and value, followed by DACH and France. DACH’s 22% share of PE deal count is a new record, though its share of deal value was less than 15%. The value of PE buyouts as a proportion of GDP in DACH is significantly lower than the average in Europe. We expect this to change as family / management owners become more familiar with the concept of private equity and are more willing to sell their company and accept higher leverage on the balance sheet.
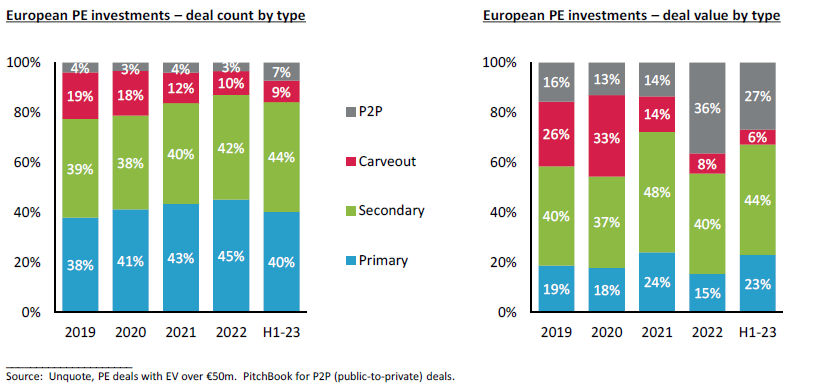
Secondary buyouts continue to take share
Despite significantly lower PE exit activity in H1 2023, it became the main source of supply for PE investments, ahead of primary deals, corporate carveouts and P2Ps (public-to-private). PE firms have chosen to exit some portfolio companies sooner rather than later to i) evidence a successful track record when out fundraising, and ii) distribute capital back to LPs (limited partners) who are becoming more reliant on distributions to fund capital calls.
European P2P M&A activity continued in H1 2023 with deals such as Dechra Pharmaceuticals (£4.5bn), Software AG (€2.2bn) and Applus (€1.3bn) listed in London, Frankfurt and Madrid respectively. P2P activity was driven by market capitalisations that are ~25% lower than their peaks, allowing sponsors to deploy dry powder with attractive valuations.
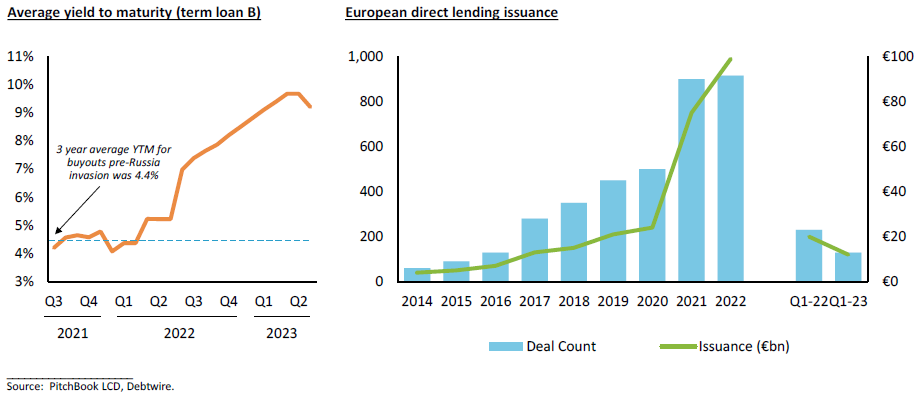
The public debt markets are open and pricing has stabilised, but lenders remain highly selective
European public debt markets became more active in H1 2023 for a few LBO financings, not just refinancings, amend & extends and add-ons as we saw in Q4 2022. Secondary prices have stabilised, providing a supportive backdrop for the syndicated leveraged loan market in 2023. For example, pricing for the 7-year €1bn loan for Silverlake’s P2P of Software AG was Euribor + 475bps for a yield of 8.94% and an OID (original issue discount) of 98.75. Debt funds remain a viable alternative to publicly syndicated deals, evidenced by the €1.5bn unitranche loan for One Rock Capital Partners’ buyout of Constantia Flexibles and the €1.25bn unitranche loan for EQT’s P2P of Dechra Pharmaceuticals.
In the middle-market for credits with €10 – 50m EBITDA, both traditional banks and debt funds are highly selective in today’s recessionary environment. Debt advisors are often conducting a broad lender outreach given the lower take-up rate by lenders than in prior years. The leverage differential between banks and debt funds has decreased driven by the overall interest cost, though the simplicity of dealing with just one debt fund remains a consideration. Club deals with 5 – 10 banks are being seen given the preference to minimise interest cost. Incumbent lender support provides confidence for onboarding new lenders in bank club deals and portable debt facilities provide flexibility to the next owner in a refinancing ahead of a potential sale process.
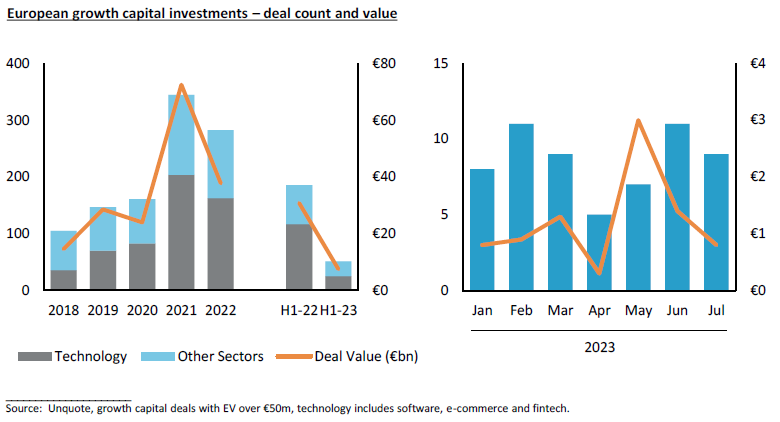
Decline in growth capital activity similar to PE market
Like European mid-market PE activity, growth capital deal count and value was down 70% and 75% respectively compared to H1 2022. Growth equity investors are targeting Technology companies with positive cash flow or minimal burn for the majority of investments, though half a dozen of the larger deals were in the Renewable Energy sector.
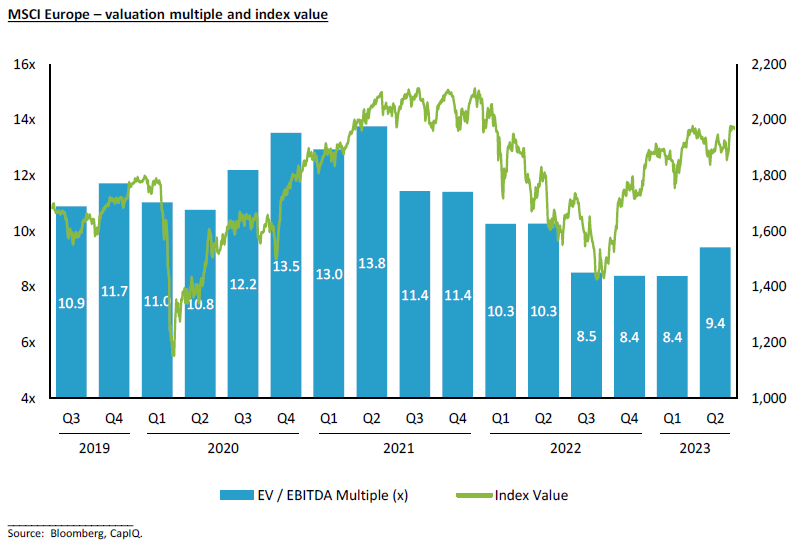
Recent European stock market recovery, including a modest valuation uplift in Q2 2023
The MSCI Europe, a broad stock market index, peaked at the end of 2021, declined 30% over the course of 2022 and has since recovered, now being just 5% below its peak. However, the MSCI Europe valuation multiple has shown a greater decline and is still 30% lower at 9.4x EBITDA than its peak of 13.8x in 2021. In comparison, valuation levels for the private M&A market appeared more resilient, with the average European LBO multiple having come down by 20% to 9.6x EBITDA in H1 2023 compared to its peak of 12.5x in 2021. If public equity valuations continue to recover in H2 2023, we are also likely to have seen the trough for private M&A valuations (assuming no further interest rate rises).
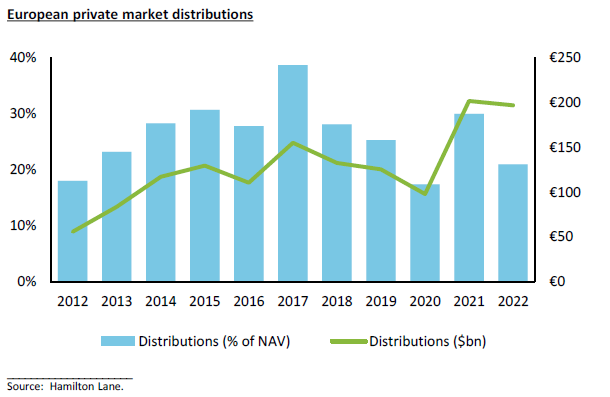
Low DPI environment is impacting fundraising, but could also accelerate PE exits
While distributions to LPs have significantly slowed since H2 2022, the pace of capital calls has not decreased to the same extent, putting pressure on LPs’ ability to commit capital to GPs. Distributions as a percentage of NAV (net asset value) was 21% in 2022, a ten year low (excluding Covid in 2020). Many LPs are only willing to commit capital to new funds if the GP’s prior fund distribution to paid-in (DPI) ratio is above 0.5x. We are therefore seeing select PE exits be prioritised ahead of fundraising, a trend which we could see accelerate in 2024. European PE firms with mature portfolios are also increasingly using fund level leverage (via NAV facilities) to accelerate distributions back to LPs.
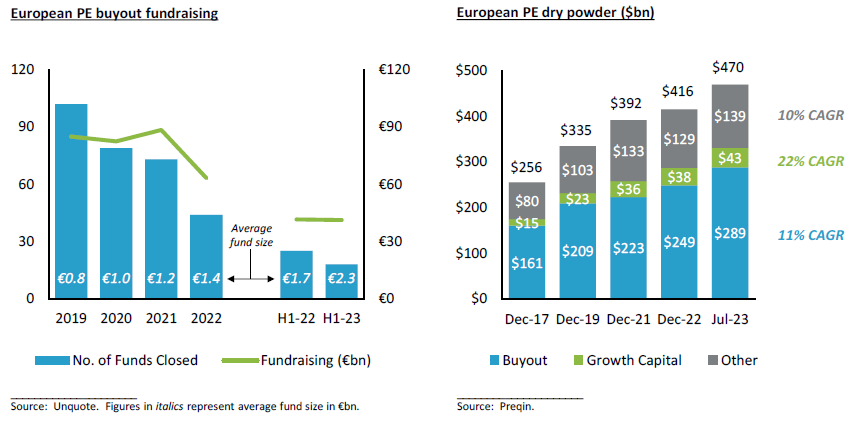
Difficult fundraising environment as LPs focus their allocations on the most successful GPs
The fundraising market continues to bifurcate as the larger, most successful GPs take a bigger share of LP commitments. The number of European PE buyout fundraisings was down 30% in H1 2023 compared to H1 2022, while the total amount raised stayed flat, driven by a few large funds, including Permira VIII (€16.7bn), KKR European Fund VI ($8bn) and Waterland PE Fund IX (€3.5bn). The average fund size reached €2.3bn in H1 2023, almost triple pre-Covid. However, there are still a number of PE firms struggling to reach their target fund size today and need more time to do so. The average time to fundraise has increased 50%, from 12 months to 18 months, with some delaying their “final close” to benefit from LPs’ 2024 allocations. Despite this, PE dry powder is at record levels.
Increase in the proportion of GP-led secondary transactions
To facilitate capital return to various investors while holding onto high quality assets, GP-led single- or multi-asset continuation vehicles (CV) were relatively popular in Europe in H1 2023, following similar trends in the US. Software & Technology, Services, Healthcare and Industrial were active sectors from a secondaries perspective. CVs included Charterhouse (Sagemcom, SERB), One Equity (USCO, DWK Life Sciences), Oakley (IU Group), Maguar Capital (HRworks), Montana Capital (Sanecum Group), Volpi (CycloMedia, Digital Barriers), Triton (Assemblin, EQOS Energie, Flokk, Unica) and Bencis (CurTec, The European Candy Group, Pressure Thermal Dynamics, Prinsen Berning).
Focus on EBITDA growth (rather than multiple expansion) to create value
Robust buy-and-build activity continued for European PE portfolio companies in H1 2023 with lenders supporting such activity despite the higher cost of debt financing. The average hold period for PE exits in 2022 and H1 2023 was 5 years. We may see the average hold period increase in the coming years as PE firms focus on meaningful EBITDA growth to outweigh the impact on enterprise value from a lower exit valuation multiple (compared to the peak in 2021).
Strong M&A backlog and scale of today’s PE industry could drive a recovery in M&A activity in 2024
Anecdotal experience suggests that European PE firms have intensified their dialogue with advisors about exit alternatives for portfolio companies and have started preparing for sale processes with timetables into 2024. US PE firms are already seeing an acceleration in new opportunities (“teasers”) coming in from advisors launching M&A processes into the market. A meaningful recovery in the European M&A market is therefore likely to lag the US by one or two quarters, similar to prior downturns, including the GFC (Great Financial Crisis of 2008 / 2009) and Covid (2020).
It took 6 calendar years after the 2007 peak for the number of European PE investments (with €50m+ EV) to return to its prior 3 year average of 335 deals per annum (p.a.). We believe it will be a shorter time period after the 2021 / H1 2022 peak for PE activity to return to its prior 3 year average of 500 deals p.a. based on the GFC being a deep / profound crisis and because the PE industry today is structurally different to 15 years ago in terms of:
- Scale – sustained growth in the number and size of PE portfolio companies, creating a large supply of M&A targets
- Liquidity – record $289bn of European PE buyout dry powder in July 2023, double the amount from a decade ago
- Financing – lending appetite from traditional banks as well as European private debt funds with a record $150bn of dry powder (50% for unitranche loans) as of July 2023, tenfold the value from 15 years ago
- Information – development of supporting infrastructure, both within PE firms and third-party service providers, enabling better deal sourcing, deeper due diligence and more strategic add-on acquisition screening
The above factors, as well as the pipeline of current M&A mandates, will likely outweigh the drag from higher interest rates, enabling robust PE M&A activity to come back quicker than after the GFC (as an example, please see the chart below where illustrative data has been used for 2023 – 2025).