Markets & the Economy: Volatility on Volatility
This content does not reflect any recommendations of Baird.
Pockets of madness rev up quickly, the quantum/alt-power/meme stocks (like Avis) stuff runs hot in a hurry. Is AI the only game in town and how long can it carry the global markets in the new world?
Add it to the ETF Line Up
New Launches: (week ending 5/1) a few highlights…
- WRTH~ Worth Charting Options Income ETF
- AMA~ Defiance Daily Target 2x Long AMAT ETF
- POEL~ Defiance Daily Target 2x Long POET ETF
- QQMY~ Corgi Growth & Tech Buffer ETF; solid day one with $5m in volume- this is part of a wave of low-cost buffer funds, Corgi is 30bps much lower than top dogs Innovator & FT which are 80-90bps
New Filings
T Rowe Active Crypto ETF filing~ TKNZ; notable because it’s by far biggest active manager to apply their active prowess to this space
Roundhill filing for more prediction market ETFs to track Recession YES & Recession NO…
- GDPD~ RPM Recession YES ETF
- GDPU~ RPM Recession NO ETF
Bitwise filing for new prediction market ETFs also related to recessions & also tech layoffs…
PredictionShares There Will Be A Recession in 2026 (___)
PredictionShares There Will Not Be a Receition in 20206 (___)
PredictionShares More Tech Layoffs in 2026 Than 2025 (___)
PredictionShared Fewer Tech Layoffs in 2026 Thank 2025 (___)
ETF Check Up
ETF Buzz...
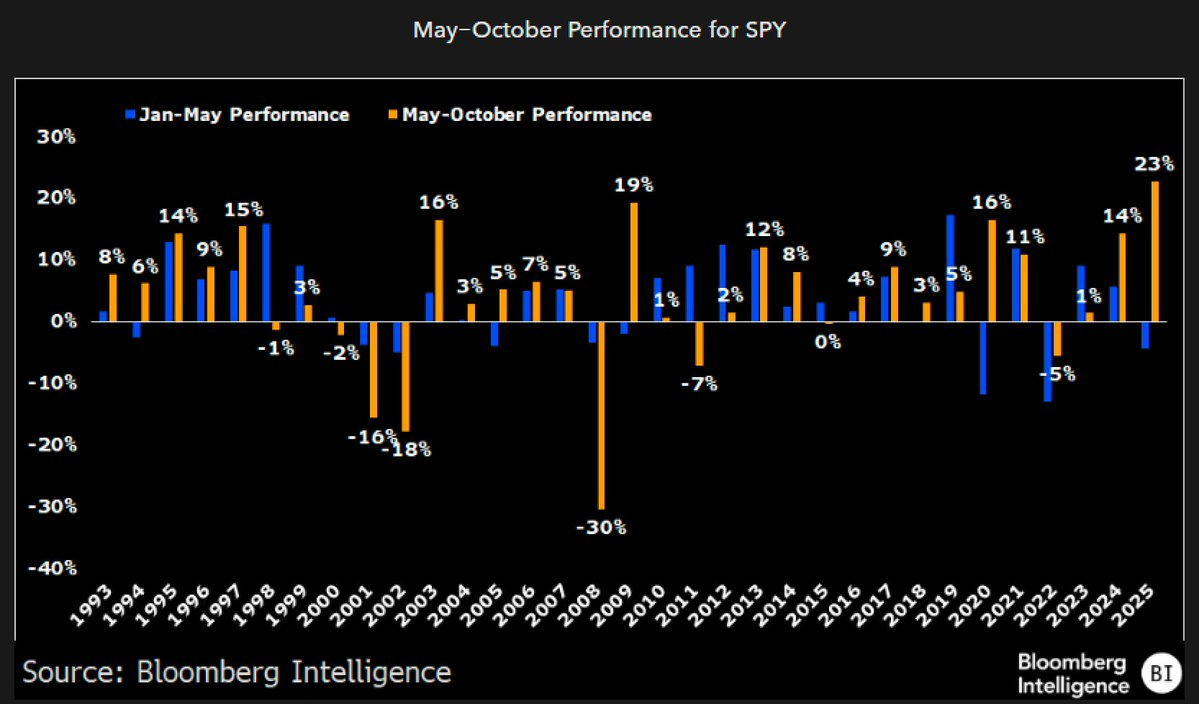
It may be time to retire ‘Sell in May’…
- SPY has been positive in 25 of the past 33 May-October periods, with only 2022 negative in the last decade
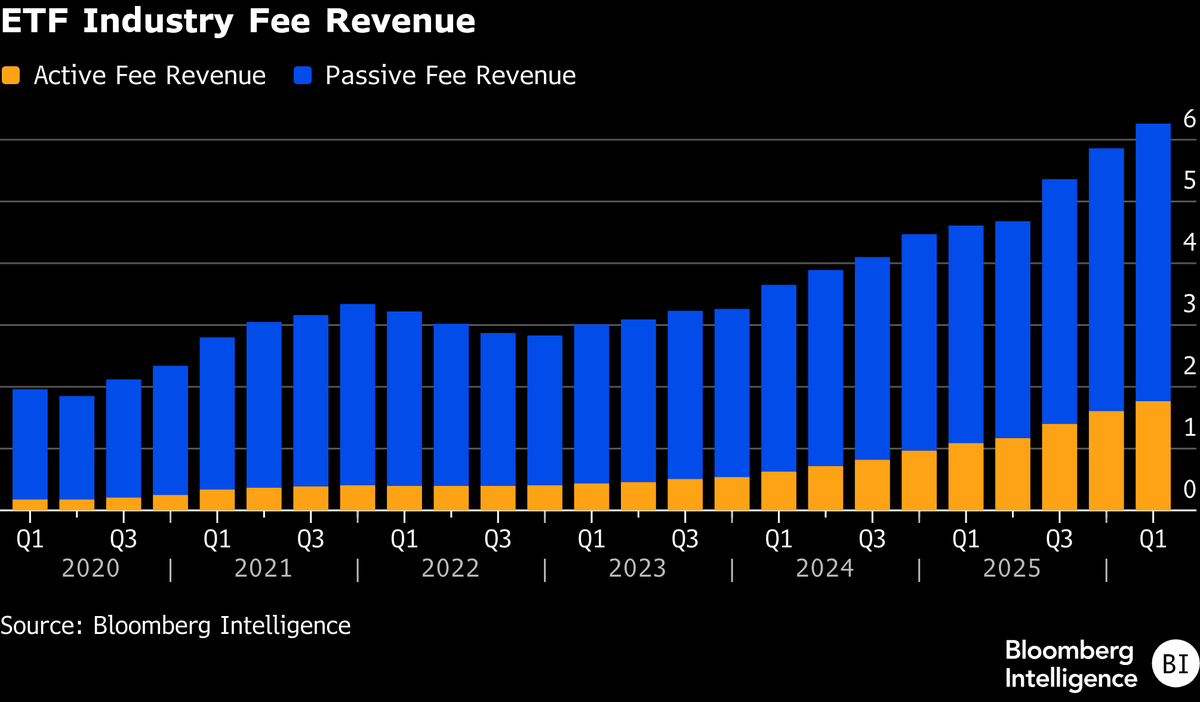
ETFs hit record fee revenue in Q1 of $6.3B, about 7% over previous peak set in Q4
- Active funds flexing their muscle, making up 28% of the revenue pie despite 11% of aum
- Makes sense as it charges more so this reflects their flows, active took in 37% of cash so far this year