
Markets & the Economy: Risk On, Rally On…
This content does not reflect any recommendations of Baird.
Note three dispersion themes playing out as the global economy & markets navigate the fallout from this Middle East War…
- Wall Street vs Main Street
- The US vs the rest of the World
- Tech vs Consumer Discretionary
Can we believe this bounce…A Record Rally with Record Highs in Record Time
Add it to the ETF Line Up
New Launches: (week ending 4/17/26) a few highlights…
- BHYP~ Bitwise Hyperliquid ETF
- ORBX~ Global X Space Tech ETF
- CAGE~ Calamos Autocallable Growth ETF
- VDV~ Vanguard Developed Markets ex US Value Index ETF & VDG ex US Growth ETF
New Filings:
Tema filing for a Memory ETF; no doubt seeing $DRAM’s insta success (just launched on 4/2 and already nearly $500M in aum)
Goldman jumping into the bitcoin ETF game…with a filing for a Bitcoin Premium Income ETF
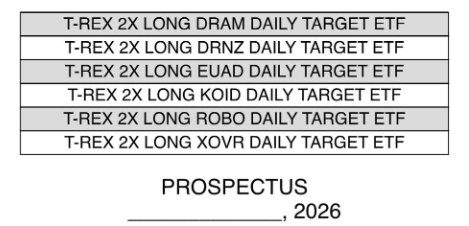
T-Rex with a filing for 2x versions of a bunch of future-y ETFs including DRAM which is only 1 week old~ humanoids, robots and drones ETFs also in the mix
ETF Check Up
ETF Buzz...
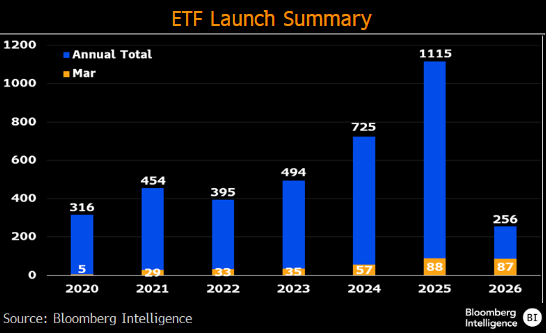
256 ETFs launched in Q1, which is 6% ahead of last year’s record pace…also on pace to break last year’s flow record by 30% and volume record by 50%
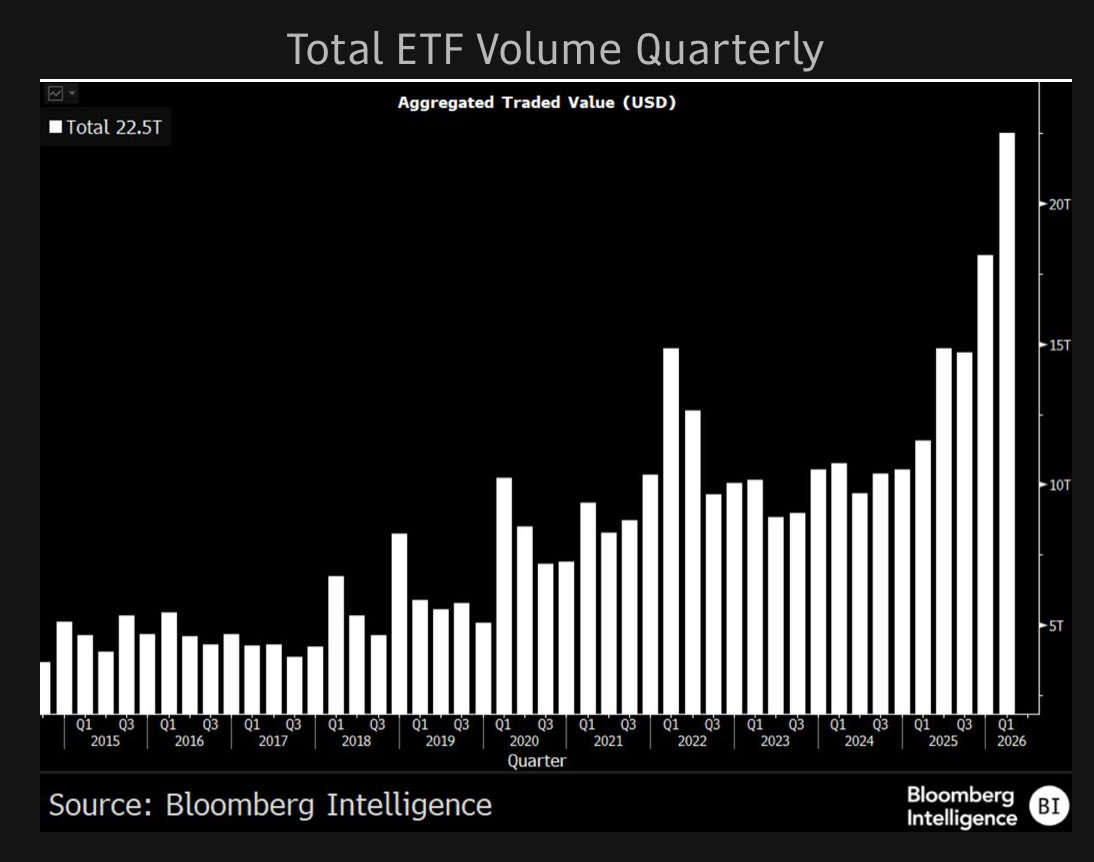
$22.5T worth of ETF shares were traded in Q1 2026…highest quarterly volume ever recorded~ Volume on pace to beat last year’s record by 50%
Looking across 46 different country ETFs since the start of the Iran war, the global picture looks far more resilient than headlines would suggest…
- 20 out of 46 have already fully recovered their initial losses, even w the conflict still ongoing
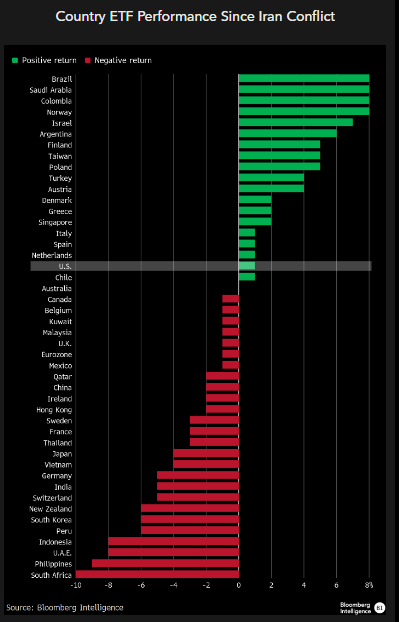
Source: Bloomberg data as of 4/17/2026
Performance numbers are as of the market close on Friday, 4/17/2026