Mid-Year 2023 M&A Outlook – Light at the End of the Tunnel?
M&A market participants are entering the second half of 2023 searching for signs of improvement in transaction activity. Difficult conditions during H1 2023 included higher financing costs and disparate views on valuation, resulting in fewer closed transactions. We see potential for global M&A activity to rebound during H2 2023 pending more clarity on the economic outlook, as strategics and sponsors are increasingly finding ways to get deals signed despite market challenges.
The trajectory of deal activity remains subject to many variables, including the monetary policies of central banks in the U.S. and Europe. While further tightening by the U.S. Federal Reserve is possible in the near term, the market’s focus should shift toward anticipated policy easing in subsequent periods pending economic data during H2 2023. For this reason, we also discuss the potential impact of future Fed rate cuts on M&A activity.
In the sections below, this article expands on these key points:
- H1 2023 M&A results were weak due to economic uncertainty along with higher debt costs and the related impact on valuations
- Activity seems poised to improve in H2 2023 based on signs of progress in market conditions and in our current processes
- PE firms appear ready to expand the target supply, spurred by the need for portfolio company realizations to support fundraising
- Many financial sponsors are pursuing buy-and-build strategies to reduce dependence on large debt financings
- Strategic acquirors remain well positioned to secure prioritized assets in the near term given less competition from sponsors
- Historical analysis shows that past Fed rate cuts have, in part, offset major headwinds and helped support M&A activity
- Anticipation of future rate cuts could bring relief on financing rates and spark M&A activity in advance of policy actions
Contact Baird’s Global M&A Team
Recent M&A Environment Difficult
While buyer appetite remains strong for “top quartile” assets, overall M&A activity was weak across the first half of 2023, largely reflecting the impact of economic uncertainty as well as higher financing costs and the related challenges of buyers and sellers reaching agreements on suitable valuations for available targets. The sluggish status of the M&A market during H1 2023 is evident in the data presented in the table below; larger declines versus H1 2022 (relative to versus H2 2022) reflect better market conditions in the first half of 2022 than in the second half of last year.
Global M&A Data for H1 2023
| vs. H1 2022 | vs. H2 2022 | |
| Overall Deal Count | -25% | -14% |
| Overall Deal Value | -40% | -4% |
| $1B+ Deal Count | -32% | -7% |
| $100M-$1B Deal Count | -41% | -23% |
| Sponsor Acquisition Deal Count | -33% | -15% |
| Sponsor Sale Deal Count | -46% | -34% |
| Strategic Acquisition Deal Count | -18% | -12% |
Source: Dealogic
Factors weighing on global M&A activity since mid-2022 include:
Recession concerns
- Fears of a potential recession due to the long lag effects of Fed policy tightening have dampened M&A activity.
- Macro research provider Strategas (a Baird company since 2018) currently projects meager U.S. GDP growth through H1 2024 while forecasting two quarters of negative real GDP comparisons: -0.5% in Q4 2023 and -1.5% in Q1 2024.
- In mid-May, the European Commission announced slight upward revisions to its GDP growth estimates for the EU, projecting 1.0% in 2023 and 1.7% in 2024. In April, the IMF estimated GDP contraction of 0.3% during 2023 in the UK, where inflation has been a larger drag.
- Many buyers want more visibility into the outlooks of their businesses and for the prospects of potential targets before pursuing acquisitions. In the current backdrop, buyer due diligence includes assessing each target’s resilience to recessionary pressures and inflation.
Higher financing costs
- Spreads have widened along with the base SOFR (Secured Overnight Financing Rate) hikes that have accompanied Fed rate increases, resulting in much higher debt funding costs; for public leveraged loans, average new issue pricing in H1 2023 was ~10% vs. 5-6% during H1 2022.
- Also reflecting the difficult backdrop, original issue discounts (OIDs) on new loans have increased, and minimum equity percentages on LBOs have risen as leverage levels have contracted.
- While still selective even at lender-friendly terms, direct lenders have generally supported the LBOs and add-on activity of financial sponsors, particularly in incumbent situations.
- Issuance in U.S. and European public leveraged finance markets showed signs of progress in Q2 2023 after a slow start to the year for volumes.
Valuation gap between buyers and sellers
- Since the latter part of 2022, a significant portion of M&A processes have experienced a notable disparity in views on valuation between buyers and sellers (discussed further here), inhibiting transactions.
- In most sectors, valuations are below 2021’s peak; however, in our processes, purchase price premiums for best-in-class assets are still at attractive levels on an absolute and relative basis.
- Among sellers, we have seen a delay in accepting lower valuations driven by the higher cost of capital. However, recent processes indicate that the value expectations of sellers and buyers may be increasingly converging.
H2 2023 Outlook – Reasons for Renewed Optimism
We see potential for the global M&A market to strengthen in the second half of the year as more market participants become proficient at transacting in the current backdrop due to increased recognition that recent conditions could endure.
- The M&A market establishing momentum in H2 2023 largely depends on macro indicators and dynamics, with deal-making sentiment expected to improve as PE firms and corporates gain better definition on the direction of the global economy and the peak level of interest rates.
- While “the best” businesses with high resilience to recession and inflation will continue to receive the most buyer interest, the supply of “the rest” of the assets offered for sale could expand as valuation expectations among sellers and buyers move toward closer alignment and as sellers try to take advantage of the low supply of available targets.
- Although far costlier than a year ago, financing remains available at the levels needed for M&A markets to be more active, with the credit market volatility experienced earlier in the year potentially in the rear view mirror.
- The upturn in public equity markets – e.g., S&P 500 +16% in H1 2023 and +24% from the October 2022 low – has contributed to an improved tone in the M&A market and indicates greater confidence in the economic outlook.
- While the backlog of mandates in Europe is substantial, a recovery in European M&A activity could lag the U.S. by three to six months, as in prior periods, including the COVID-19 pandemic.
Increased activity in our process pipeline also provides us a growing degree of optimism in a second-half rebound for M&A.
- Across the M&A market, the slowdown since the start of the H2 2022 has resulted in a large backlog of transactions waiting to go to market.
- For our sellside mandates, we have seen growth in the number of marketing launches in recent months relative to early 2023.
- Higher process launch velocity suggests a growing number of sellers are choosing to enter the market following a long hold-out period due to understanding the fundamental change in market conditions and valuation levels versus the highest levels of 2021 and H1 2022.
- In addition, we have seen recent signs of better lending market conditions in our processes via modestly favorable shifts for spreads and leverage levels, supporting a more aggressive approach to pursuing the sale of targets.
- Even if activity ramps up as anticipated, we expect the flexibility employed frequently over the past few quarters – e.g., selective market testing of buyer appetite to inform sellside launch decisions, targeted strategic-oriented processes, contingent consideration – to remain characteristics of the M&A environment in the near term.
Sponsor Fundamentals Should Improve
In the near term, we see potential for PE firms to enhance M&A market activity by following through more frequently on plans to sell portfolio companies, thereby expanding the pool of attractive assets available to prospective sponsor and corporate buyers.
- The number of sponsor M&A exits decreased 46% during H1 2023, reflecting the weaker financing and valuation backdrop.
- Given the slowdown in selling since H2 2022, a large backlog of targets is waiting to enter the market as macro visibility and financing dynamics improve.
- The fundraising challenges experienced by PE firms over the past year-plus (including to date in 2023) create urgency for achieving exits. Sponsors need to drive liquidity events, as the number of companies owned by a U.S.-based sponsor after a hold period of 4-6 years exceeds the year-end 2019 figure by 30%+.
- Based on relatively low distribution levels recently, LPs are increasingly looking for a return of capital, pushing more private equity firms to explore transactions for their best portfolio companies in a market where the supply of top-tier opportunities is limited.
- With strategics remaining active, many sponsor sellers are calibrating outreaches and processes around strategic interest, although we are also conducting a significant number of broader auctions for our mandates.
- Due to lingering differences in valuation perspectives between buyers and sellers, we’re seeing market participants explore creative solutions such as contingent consideration, rollover stakes, structured equity, and seller financing as ways to mitigate funding gaps.
Although open for new investments, financial sponsors remain eager for relief on financing terms, as the higher cost of debt has curtailed a substantial amount of buying (and selling) over the past several quarters.
- In H1 2023, the number of sponsor acquisitions fell 33% vs. H1 2022, while sponsor purchase deal value decreased 59%, with this disparity indicating greater focus on add-on deals amid increased risk aversion as well as challenges in financing larger LBOs.
- While actively participating as bidders in processes, sponsors have been cautious and selective, focusing on sectors where they have an angle given the reduced availability of leverage.
- Among sponsor buyers, we have observed broader demand for assets in the lower middle market ($10-50 million of EBITDA) relative to larger-cap platforms due to financing availability and risk tolerance considerations.
- PE firms have also demonstrated an increased appetite for sponsor partnerships and minority investments, with significant transaction activity continuing in these segments in the first half of 2023.
- Despite LBO financing challenges, 2023 is shaping up to be another strong year for public-to-private (P2P) deals with sponsor acquirors, as in 2021-2022. Through late June, the number of P2P transactions is on pace to reach an annual high, indicating that PE buyers and selected targets are still seeing a disconnect between public and private market valuation levels.
- Our analysis of publicly listed companies in the Industrial sector demonstrates meaningfully higher EBITDA multiples at market capitalizations exceeding $2 billion (median valuation above 10x) than for entities valued below $2 billion (median multiple below 8x), helping explain the appeal of the take private option for smaller-cap companies.
Strategic Buyers Remain in a Strong Position
Many corporate acquirors continue to have a competitive edge in securing targeted assets in the current environment.
- Global metrics for corporate acquisitions decreased in H1 2023, with the deal count decline of 18% largely reflecting the valuation gap and lower leverage capacity noted earlier.
- Reported deal value for strategic acquisitions in H1 2023 was nearly 10% above the H2 2022 figure, highlighting the successful pursuit of larger assets by corporates.
- M&A appetites remain healthy among many strategic buyers, which are still in deployment mode given cash on the balance sheet (approaching $2 trillion for U.S. listed, non-financial companies) and slow organic growth.
- Our H1 2023 sellside activity included a higher proportion of narrow outreaches oriented toward strategic buyers; we expect the second half of 2023 to continue to represent an opportunity for corporates to approach high-priority targets, albeit with sponsors possibly becoming more aggressive buyers than over the prior 6-12 months.
- Although macro uncertainty may continue through the second half of the year, positive economic updates relative to low expectations could cause more corporates to execute on planned strategic M&A activity.
- Analysis of public company stock performance following announcements of large acquisitions during periods of GDP weakness is instructive in demonstrating the potential for outsized returns, at least in part due to the higher valuations generally received by public companies with greater scale.
- As detailed below, public companies undertaking major acquisitions* experienced significant outperformance relative to the S&P 500 on a 1-year and 3-year basis.
- This analysis suggests the potential for higher rewards from acquiring during periods when many buyers are in risk-off mode due to focus on capital preservation amid increased financing costs and concerns about operating results.
Total Shareholder Return of Public Company Acquirors vs. S&P 500 After Large Deals During Economic Weakness
| Relative Outperformance | 1 Year After Announcements | 3 Years After Announcements |
| Median | 2% | 7% |
| Average | 4% | 16% |
Source: Capital IQ, Dealogic
* Analysis focuses on U.S.-based public companies announcing $500+ million acquisitions that represented at least 10% of market capitalization during 2001-2002 and 2007-2008 in the Consumer, Healthcare, Industrial, and Technology & Services sectors.
Historical Fed Rate Cut Analysis
With Fed rates potentially starting to head lower within the next year, we believe a preliminary review of M&A activity during prior rate cut cycles is worthwhile. After the Fed paused on further rate increases in its June meeting, the rate hike cycle appears near its end, although at least one more increase appears possible, as Strategas projects in late July.
While we believe the insights provided here apply to M&A during periods of monetary tightening in large markets such as Europe and Asia, our analysis focuses more on U.S. M&A activity (which represented 52% of disclosed global deal value over the last 10 years) due to the closer tie to Fed rate actions. The European Central Bank and the Bank of England typically follow the Fed in terms of the direction of central bank interest rate changes.
Once the Fed signals the end of rate increases, we expect capital market participants to focus on a potential shift toward policy easing within the following 6-12 months, especially if inflation continues to taper while economic growth slows due to the lagged impact of substantial tightening over the past year. We note the potential for alternate scenarios, such as (i) an extended period that includes continued modest GDP growth along with inflation hovering above Fed targets or (ii) sustained economic weakness that pervades deep into 2024, leading to downturns in company financial results.
Key points on our rate cut analysis before going into detail:
- We included the last two rate cut scenarios (detailed below); in each case, rate reductions historically preceded GDP contraction, and M&A activity showed progress after economic expansion resumed.
- History may not be a guide to future M&A results given the extreme negative factors experienced in earlier cycles, as past rate decreases occurred amid major economic shocks and extensive stock market weakness, limiting the benefit to M&A.
- We excluded the January 2001 rate cut case due to various factors that impeded M&A for an extended period following the start of that cycle. The 2001-2002 period posted the two lowest single-year GDP growth rates of 1992-2007, with difficult conditions compounded by the events of September 11, 2001. During this time, equity markets experienced an extended bear market, falling 49% from the prior high by October 2002.
- During an upcoming rate cut cycle, the M&A market could have fewer headwinds relative to prior cases, suggesting a larger pickup in transaction activity.
Review of Historical M&A Data After Initial Rate Cuts
The last two Fed rate cut cycles – starting in 2007 and 2019 – corresponded to a modest uptick for M&A activity during the first six months immediately following these rate reductions, relative to activity in the preceding two years. M&A counts decreased slightly over the full first year, dampened by GDP contraction during these periods. We consider M&A activity being close to flat in first year of these two scenarios to be encouraging for the upcoming situation given the severe macro shocks seen in these cases:
- The Global Financial Crisis followed the September 2007 cut, with U.S. GDP shrinking in five of the six quarters through Q2 2009 and with the S&P 500 declining 57% from its peak through March 2009.
- The M&A market came to a virtual halt in April-May 2020 during the early stages of the COVID-19 pandemic, depressing the first-year data following the initial rate cut in July 2019.
Due to GDP shrinking after the initial rate cut in each of the previous two cycles, we focus here on U.S. deal count data starting with the first quarter of sustained economic growth following the first rate reduction. As indicated below, deal activity tended to strengthen once M&A market participants sensed improved macro conditions. The graphic below summarizes U.S. deal activity in the first year after the return of extended GDP growth. (In the charts and text, “first year” / “Year 1” / “year one” refers to the first four quarters of consecutive GDP growth – i.e., Q3 2009 through Q2 2010 in the first case.)
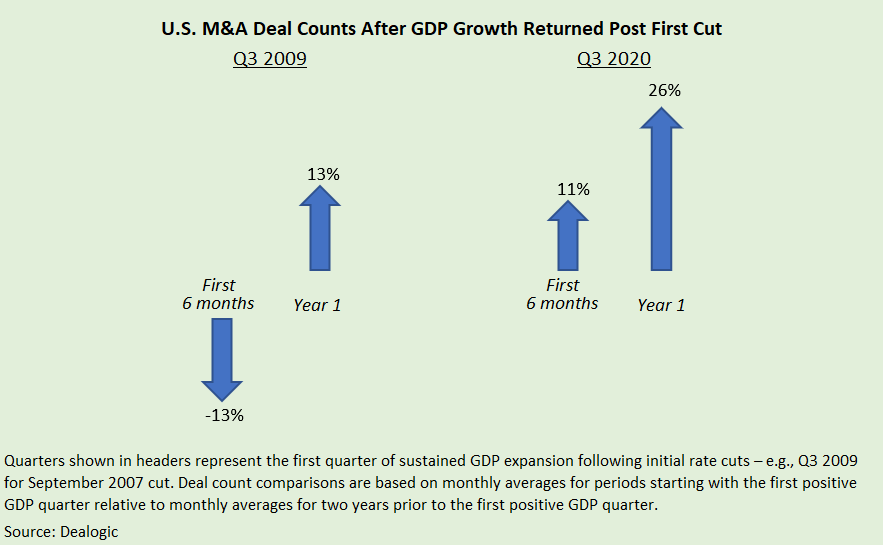
- In the 2009 case, the deal count registered low-teens percentage growth in year one even though the M&A market needed time to find its footing after a year and a half of GDP contraction and in the face of lending market interest rates remaining unusually high (averaging 8%+) despite Fed rates near 0%.
- The most recent scenario is still fresh in everyone’s minds, involving a strong rebound for M&A starting in the second half of 2020 once the economic rebound gave deal makers the confidence needed to capitalize on massive monetary easing.
Comparison to the Current Environment
After reviewing the main similarities and differences relative to previous rate cut periods, we believe M&A activity will face fewer headwinds during the upcoming cycle. We note the following general comparisons to past experiences.
Potential similarities to prior rate cut cycles:
- GDP contraction is projected around the time of the first rate cut, as seen in the prior two cases presented in this piece. As indicated in our analysis, M&A activity showed more strength after the resumption of GDP growth than immediately following the initial rate cuts.
- Whenever benchmark Fed rate easing begins, rates will be falling from above 5%, as in the 2007 case. The relatively high level provides the Fed with ample room to decrease rates over a multi-year period, with the caveat that the level of reduction will depend on further declines for inflation.
Key differences relative to past rate cut periods:
- The Fed rate floor would be higher than in past periods if inflation remains above the Fed’s targets through 2024. U.S. CPI growth of 4.0% in the May reading represented the lowest rate of inflation in 26 months. Nevertheless, inflation remains above the Fed’s target of 2%, requiring significant further progress before the Fed is willing to undertake meaningful easing.
- Future rate cuts should occur in an environment with lower volatility relative to the turmoil experienced in the last two rate cut cycles. While macro shocks are inherently unexpected and could be in store in the year ahead, M&A markets should avoid challenges on the order of the Global Financial Crisis (2007-2009) and COVID-19 (beginning in early 2020).
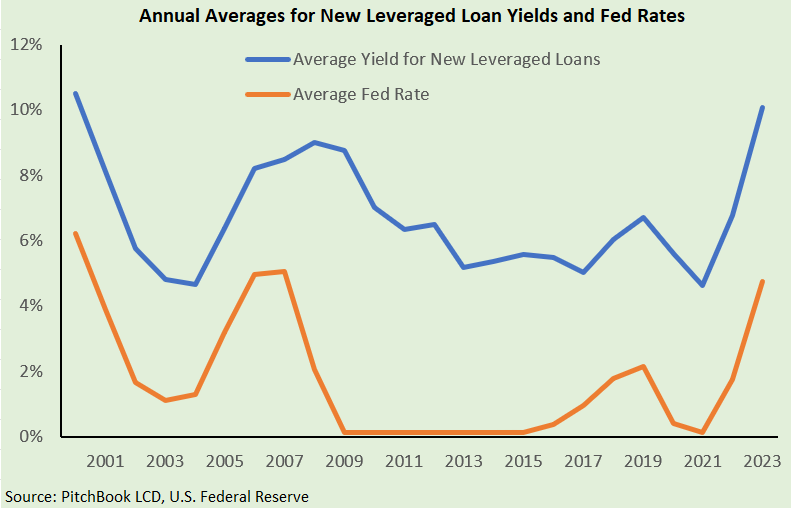
- As an indication of the higher risk premium following the GFC, the spread between the average yield to maturity for leveraged loans and the Fed’s benchmark rate was 8.7% in 2009, representing a substantial headwind for M&A activity due to elevated financing costs and far exceeding the 4-5% range for most years since 2000 and slightly above 5% in YTD 2023.
- While we cannot predict the direction of equity values, capital markets seem unlikely to repeat the large declines of the last two cycles, which dampened M&A due to the lower multiples of public companies. On average for these cycles, the S&P 500 experienced declines of 46% from peak levels, with markets bottoming 12 months after the first rate cut.
- By any measure, private equity has become a far greater force in the M&A market than in 2007. This fundamental change in the ownership model, coupled with the immense dry powder that sponsors can access, should drive a recovery in M&A activity as LBO financing fundamentals improve. Private equity firms have dramatically increased assets under management since earlier cycles, reflecting the combination of successful fundraising, robust acquisition activity, effective portfolio management, and frequent exit transactions. Indeed, the strong improvement in M&A activity, in terms of both demand and supply, beginning in the second half of 2020 can largely be attributed to the major market power of financial sponsors.
- On a global basis, control-stake M&A transactions with PE buyers rose from 21% in 2007 to 39% in 2022.
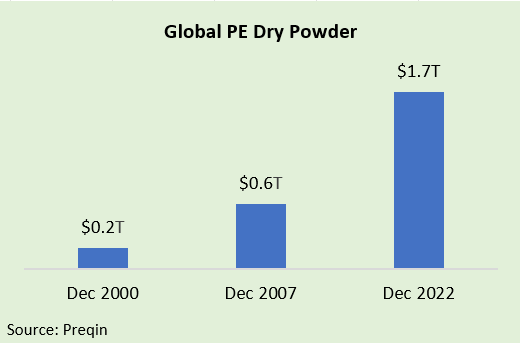
- Despite major investment activity, dry powder has risen substantially over the past 15 years; the private equity capital overhang of $1.7 trillion is roughly triple the amount from 2007.
- From 2007 to 2022, the number of PE portfolio companies in the U.S. more than doubled to reach about 11,000. PE-backed companies are highly likely to be involved in M&A activity such as add-on acquisitions, secondary buyouts by other sponsors, and exit sales to strategic buyers.
In looking at the important similarities and differences on a combined basis, we consider the most likely scenarios to represent a net positive for M&A, suggesting better results in the early stages of the next rate cut cycle than seen in prior cases.
The M&A market could become significantly busier before the end of 2023 with the environment seemingly headed in a better direction, in line with the strong recovery experienced in H2 2020. We encourage prospective buyers and sellers preparing for planned deal activity to contact Baird’s Global M&A team.