
Will the valuation gap between buyers and sellers in the M&A market narrow in 2023?
We look at public stock markets and cost of debt to discuss M&A valuation trends in an uncertain macro environment
2023 starts with relatively low announced M&A deal activity and a rising number of middle-market sell-side mandates in the backlog, many deciding when to officially launch. Increasing recession risk, rising interest rates and a decline in public stock market valuations through H2 2022 have contributed to a valuation gap between buyers and sellers in a meaningful proportion of M&A processes. Some sellers have maintained expectations closer to peak valuation levels in 2021, while we are seeing significant variation in how buyers are bidding in processes depending on their risk appetite.
Macro uncertainty continues as inflation remains higher than the target levels set by central banks, and credit risks are emerging given the heightened uncertainty created by recent problems in the banking sector. In this article, we look at public stock markets and cost of debt to discuss M&A valuation trends as well as our own observations on how middle-market M&A deals, particularly those with a private equity (PE) vendor, are successfully being agreed in today’s environment. We expand on each of our key takeaways listed below:
- Private M&A valuation is more resilient and less volatile than the public stock markets
- LBO valuations have come under increasing pressure due to financing costs and constraints
- Strategic buyers taking advantage of lower competition from PE, often in narrow or bilateral processes
- High proportion of public-to-private deals implies that many publicly listed companies are undervalued
- Publicly listed tech was the hardest hit sector, dropping to valuation levels below the private tech market
- Increasing bifurcation between “top quartile” and cyclical assets in low volume M&A environment
- Stalemate cannot last for PE – GPs need to distribute capital back to LPs and deploy dry powder
Private M&A valuation is more resilient and less volatile than the public stock markets
Major public stock market indices, including the S&P 500 and MSCI Europe, peaked at the end of 2021 and declined over the course of 2022. Russia’s invasion of Ukraine exacerbated supply chain issues, which continued to fuel high inflation and prompted central banks, led by the Fed in the US, to increase interest rates. Uncertainty around the macroeconomic outlook brought public valuation multiples down significantly, falling an average of 25% in the US and 40% in Europe.
On the other hand, valuation levels for the private M&A market appeared relatively resilient, with the average LBO (leveraged buyout) multiple staying relatively flat in the US and down 15% in Europe in 2022. However, we have seen a number of US LBO transactions in Q1 2023 where valuation levels have come down by 10% to 20% compared to similarly sized businesses in the same subsector that transacted in 2021. Most of these were PE-to-PE deals where the vendor did not suffer EBITDA multiple contraction during ownership because the company was meaningfully smaller at entry.
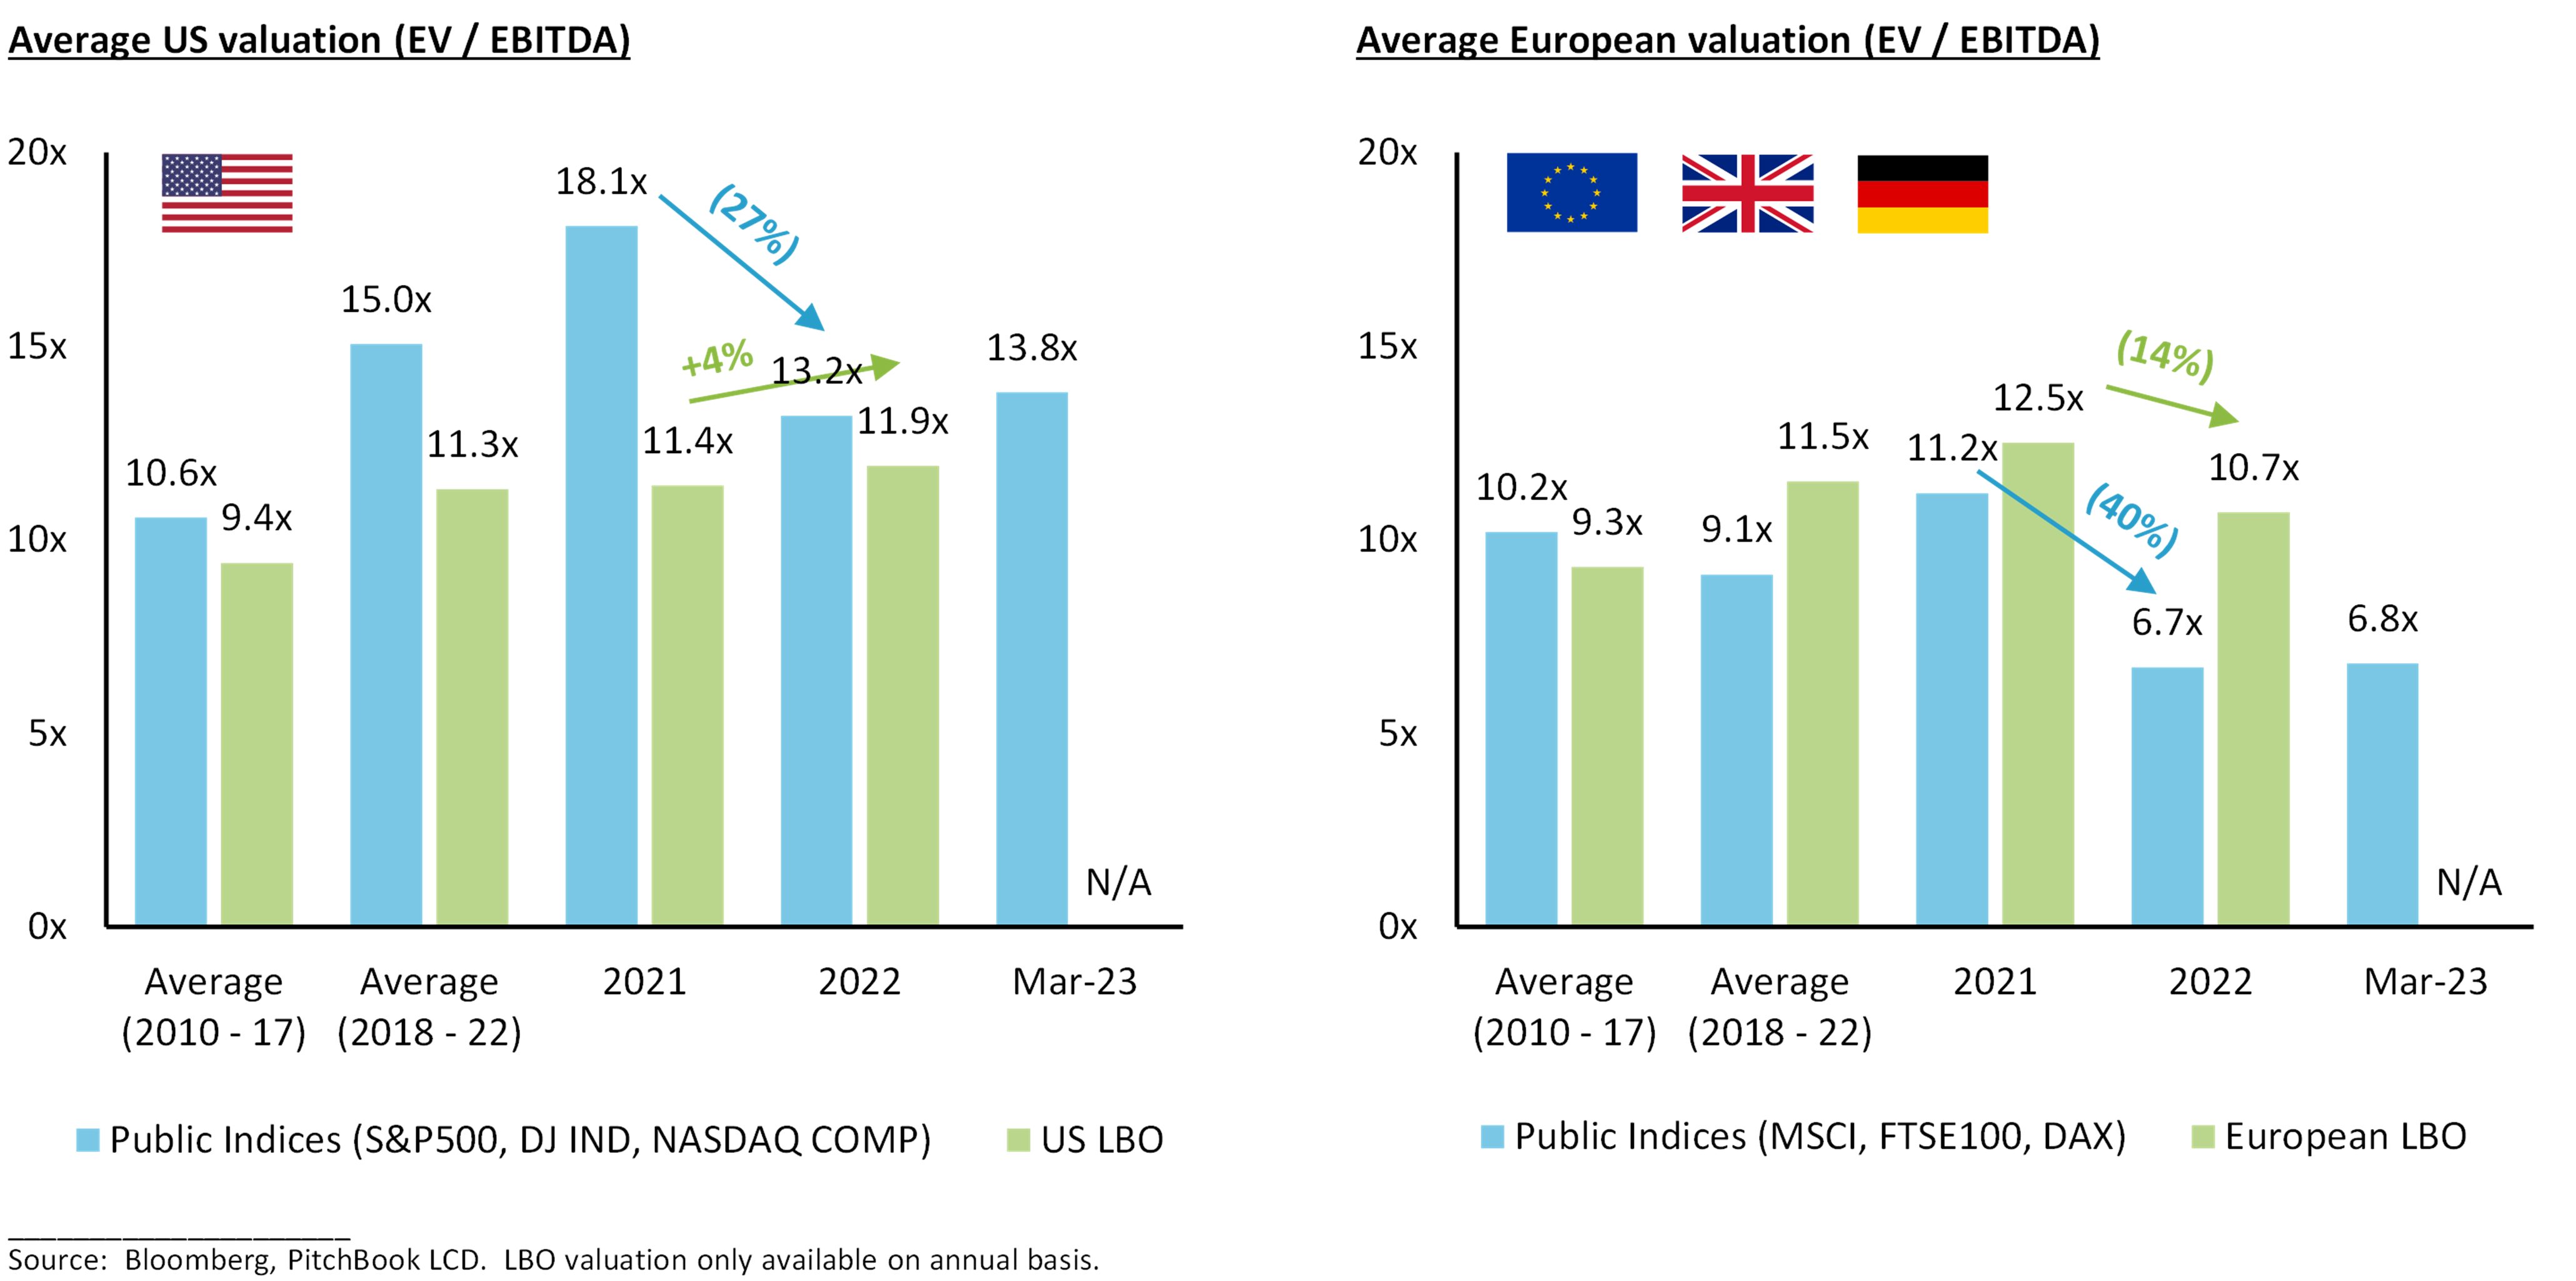
The direction of movement in valuation levels in the private M&A markets typically follows the public stock markets, but there are many factors that make them different (see table in Appendix). Notably, there is a lag of at least a few months for changing sentiment in the public markets to fully impact private M&A markets. The 2022 M&A data may not be showing the full picture of valuation compression as many sellers chose not to launch or transact in 2022. This also helps to explain why average private M&A valuations in 2022 continued to be relatively high, near their 5 year average.
However, in the last 6 months (Q4 2022 and Q1 2023), we have seen a valuation gap between buyers and sellers in a significant proportion of M&A processes. Intrinsic within this is the exclusion of the M&A processes where the seller’s valuation expectations were not met by the bids from potential buyers. Thus, there is a positive skew to the valuation data (typically EBITDA multiple) on completed M&A deals where the final buyer and seller agreed on price.
Another point of note is the significant valuation difference between the US and European stock markets. The US market benefits from a deeper, more liquid pool of capital and a larger proportion of higher growth technology companies. There is, however, limited valuation difference in the private M&A markets, where both regions have a multitude of growing middle-market companies across sectors that attract capital from both PE firms and corporates.
LBO valuations have come under increasing pressure due to financing costs and constraints
The ability to finance an LBO depends on the availability of debt. Given volatility in the public debt markets since Q2 2022, it became relatively difficult to finance LBOs above $1bn in the public debt markets in H2 2022. The private credit markets have partially filled the void with debt funds clubbing together to finance larger transactions. However, given their preference for smaller check sizes in an uncertain macro environment, the middle-market has become a “sweet spot” from a debt financing availability standpoint, both in the US and Europe. Sitting on record levels of dry powder, many direct lenders have relaxed their constraints on hold amounts in Q1 2023, once again enabling debt financing for $1bn+ LBOs, but with a strict focus on the highest quality credits.
Base rate rises have pushed overall unitranche interest cost to over 10%, limiting debt capacity for most credits to 5x EBITDA (can be higher for best assets) given “required” 1.5x fixed charge coverage ratio in the US and 2x interest coverage in Europe. A mathematical LBO exercise for two top quartile companies in the US and Europe shows that:
- To limit entry multiple valuation impact to 1x EBITDA (~10% decrease in enterprise value), the LBO must assume exit multiple accretion of 0.5x EBITDA (scenarios B and E in the US and Europe, respectively)
- Given 1x EBITDA reduction in leverage and assuming the same entry / exit multiple, the EV / EBITDA multiple would drop by 1.5x – 2.0x (~15% fall in enterprise value) to achieve the same IRR of 20% (scenarios C and F)
| US LBO | Interest Base Rate + Spread |
Total Unitranche |
Leverage Multiple |
Interest Paid over 5 Years |
Entry EV |
Entry Multiple |
Exit Multiple |
PE Buyer IRR |
|---|---|---|---|---|---|---|---|---|
| 2021 Scenario (A) | 0.3%+5.5% | $285m | 5.7x | $61m | $600m | 12.0x | 12.0x | 20% |
| 2023 Scenario (B) | 4.5%+6.25% | $235m | 4.7x | $118m | $550m | 11.0x | 11.5x | 20% |
| 2023 Scenario (C) | 4.5%+6.25% | $235m | 4.7x | $118m | $500m | 10.0x | 10.0x | 20% |
| EU LBO | Interest Base Rate + Spread |
Total Unitranche |
Leverage Multiple |
Interest Paid over 5 Years |
Entry EV |
Entry Multiple |
Exit Multiple |
PE Buyer IRR |
|---|---|---|---|---|---|---|---|---|
| 2021 Scenario (D) | 0.0%+6.0% | €315m | 5.7x | €95m | €703m | 11.0x | 10.0x | 20% |
| 2023 Scenario (E) | 3.7%+7.0% | €257m | 4.7x | €138m | €639m | 10.0x | 10.0x | 20% |
| 2023 Scenario (F) | 3.7%+7.0% | €257m | 4.7x | €138m | €594m | 9.3x | 9.3x | 20% |
Source: Baird
Stricter lending requirements and more limited access to debt capital are forcing PE firms to invest more equity (50%+ of enterprise value), putting pressure on returns and, as a result, valuations. Furthermore, in Baird’s own M&A deals signed in Q1 2023, we have seen some acquiring PE firms take lower leverage than the maximum being offered by lenders (e.g., taking 4x debt / EBITDA instead of 4.5x). Financial sponsors are most comfortable “over-equitizing” the businesses that are recession-resilient with ample organic and / or inorganic opportunities to drive growth through the various stages of the economic cycle.
Strategic buyers taking advantage of lower competition from PE, often in narrow or bilateral processes
Cash-rich corporates have a competitive edge in today’s M&A market against PE bidders given the increased cost of debt. Investors in the public stock markets have typically been supportive of growth through M&A if the publicly listed strategic buyer is not over-levered (e.g., less than 3x net debt / EBITDA post acquisition). In a number of recent cases, valuations being paid by corporates for top quartile assets with a “strategic fit” are at or near peak levels, driven by:
- Decreasing / low organic growth – many corporates are seeing declining organic growth given the recessionary environment, and even revenue growth rates of 5% are still below that of inflation – adding inorganic growth is often the most effective way of achieving “real” (inflation-adjusted) revenue growth.
- Enhancing the scale / public market profile of the business – publicly listed companies of scale garner more investor appetite and generally trade at a higher valuation than smaller players that are less well known – M&A remains the quickest way to scale a business and create a top tier leader in its global addressable market.
- Realizable revenue / cost synergies – provide the ability to pay a “full” valuation multiple, which could be up to 20% – 40% lower for the acquirer by year 3 after accounting for synergies – investors are comforted by experienced serial acquirers with a long track record of achieving synergies from prior acquisitions.
- Increasing exposure to secular growth themes – increasing the quality of the corporate’s portfolio through M&A is valued by investors, even if the target is acquired for a valuation multiple higher than the buyer, e.g., industrial manufacturer acquiring a software company in a fast growing end market to provide more holistic technologically advanced solutions and increase the proportion of recurring revenue.
Investment banks are running more nuanced M&A auctions, such as narrow trade-only or bilateral processes, where strategic acquirers are given the time and access they need to conduct comprehensive due diligence. Such workstreams were a competitive advantage for many PE firms in busier M&A markets given their institutionalized ability to be efficient in due diligence and highly deliverable on timing and contract terms. In addition to corporates, we are seeing strong interest from PE backed strategic buyers able to pay high valuations through synergies. However, PE backed strategic buyers may be limited in their ability to extend pre-existing favorable credit agreements in today’s less favorable credit market conditions.
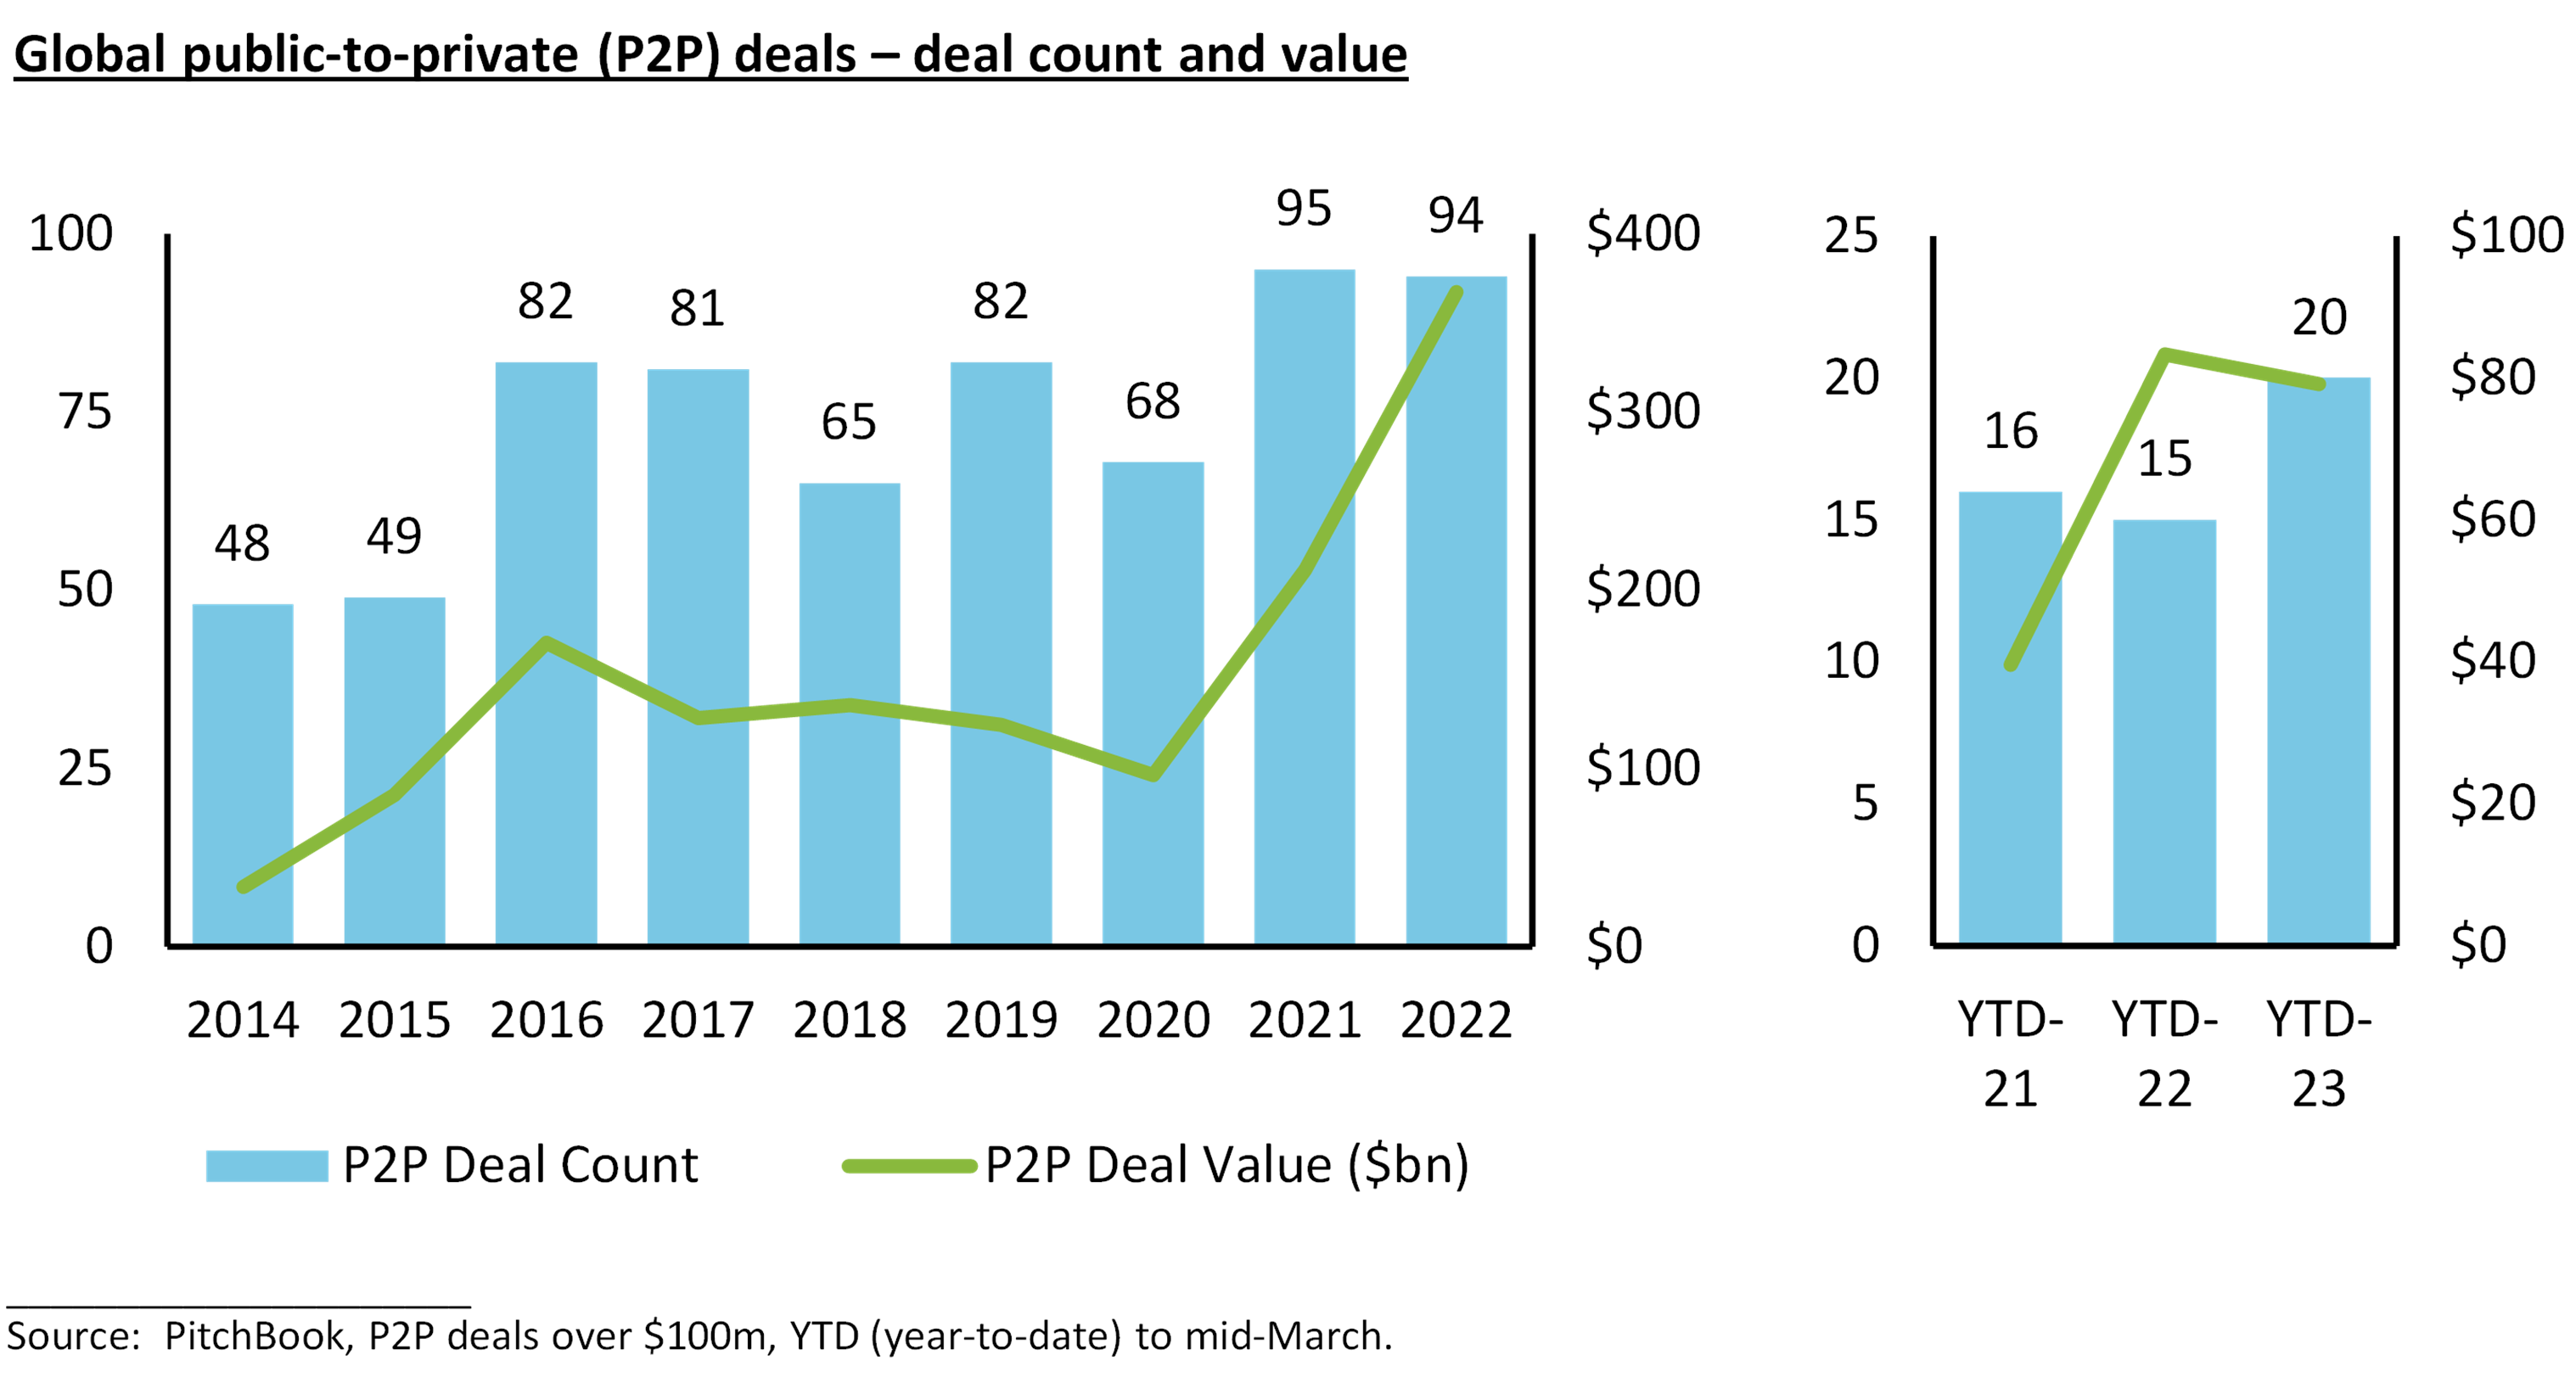
High proportion of public-to-private deals implies that many publicly listed companies are undervalued
Strong public-to-private (P2P) activity in 2022 was driven by lower (thus more attractive) public company valuations and a willingness by large-cap sponsors to deploy dry powder on bigger targets. P2P activity continues and represents an even higher proportion of overall M&A in YTD 2023 despite the difficulties in obtaining debt financing for $1bn+ deals. This implies that PE firms believe many publicly listed companies are undervalued, even when including the “control premium”. In some of these cases, the PE buyer partially exited the company via an IPO in recent years and still held a minority stake in the listed company at the time of the take-private.
Publicly listed tech was the hardest hit sector, dropping to valuation levels below the private tech market
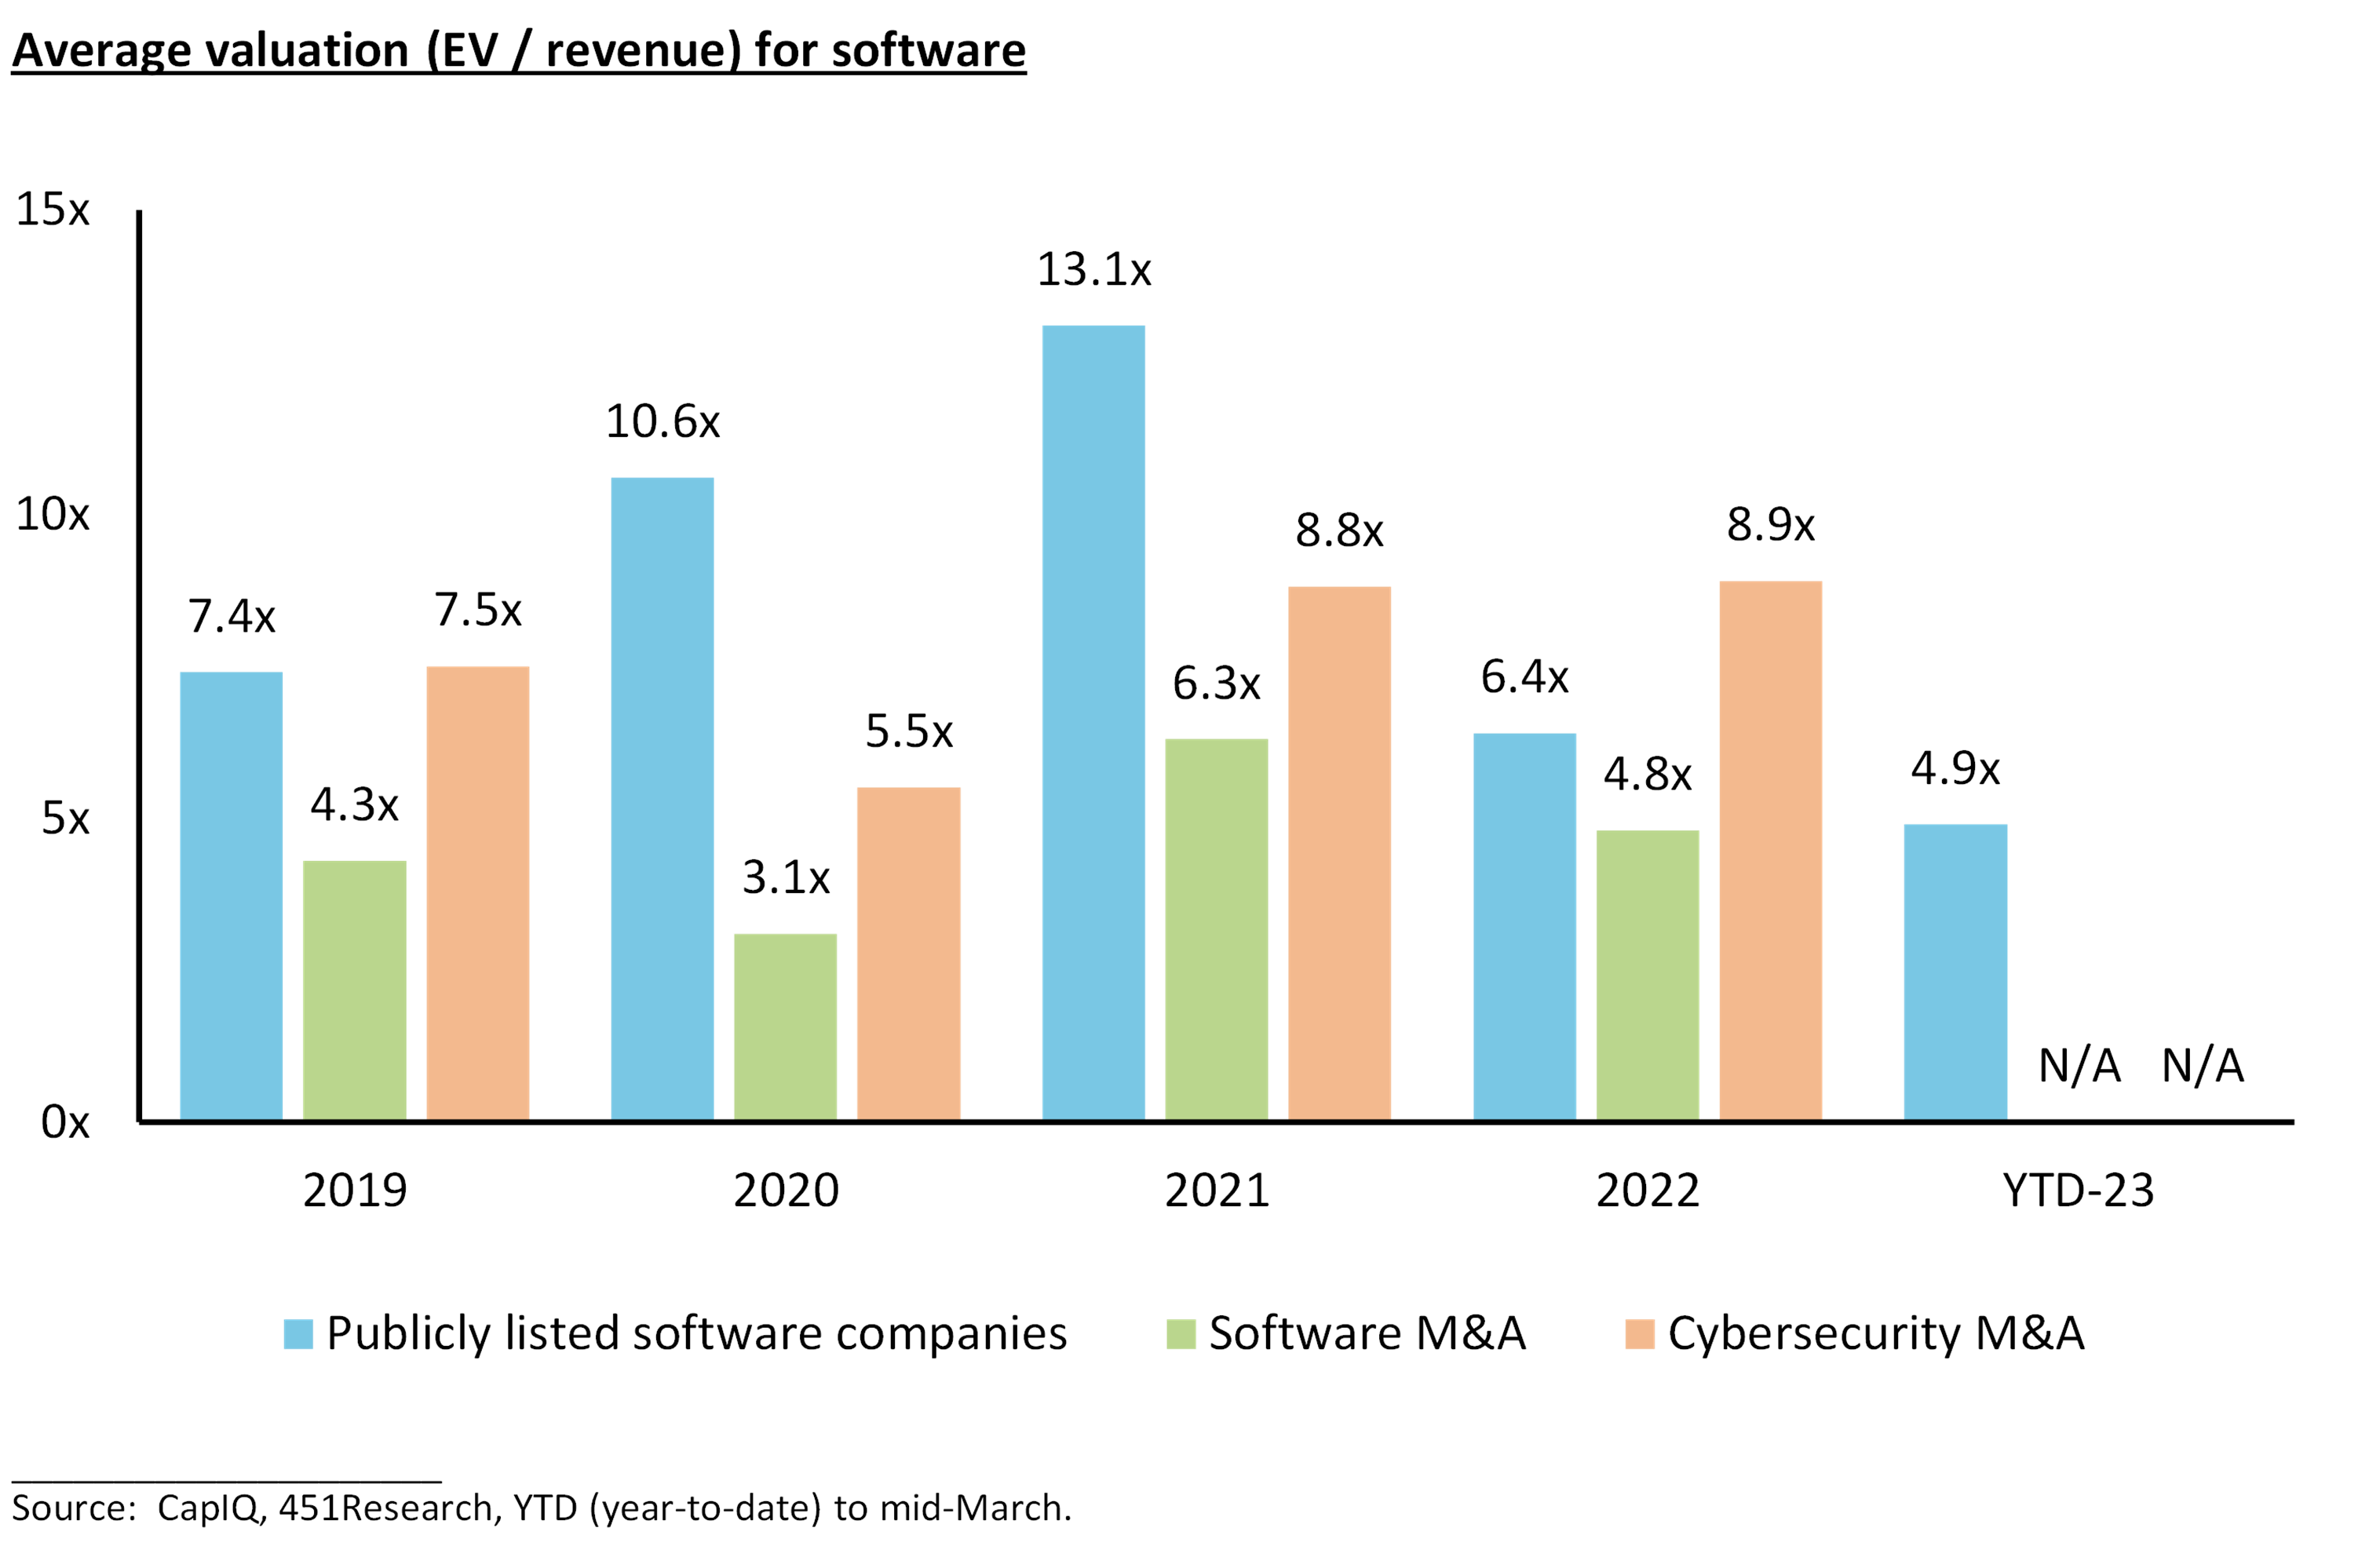
Public market performance is often inversely correlated to interest rates, particularly for “growth” stocks. As such, publicly listed software companies saw their valuation fall by over 50% from over 13x NTM (next twelve months) revenue in 2021 to 5x by mid-2022. There was a noticeable lag in private markets, which took all 6 months of H2 2022 for software M&A valuations to gradually slide down.

The large public software players are generally perceived to be lower risk and therefore benefit from higher valuations than smaller private players. However, their public valuation is now similar to the average of software M&A transactions in 2022 and actually lower than many mid-market M&A software deals completed between 5x and 9x ARR (annual recuring revenue) in recent months. For certain subsectors within software, such as cybersecurity, private M&A valuation has not come down as they are driven by recession resilient, secular growth themes. For well performing private businesses, the public markets are not always a strong indicator of a private company’s true value.
Greater valuation impact for “cash burn” stage VC tech companies than “profitable” stage PE tech companies
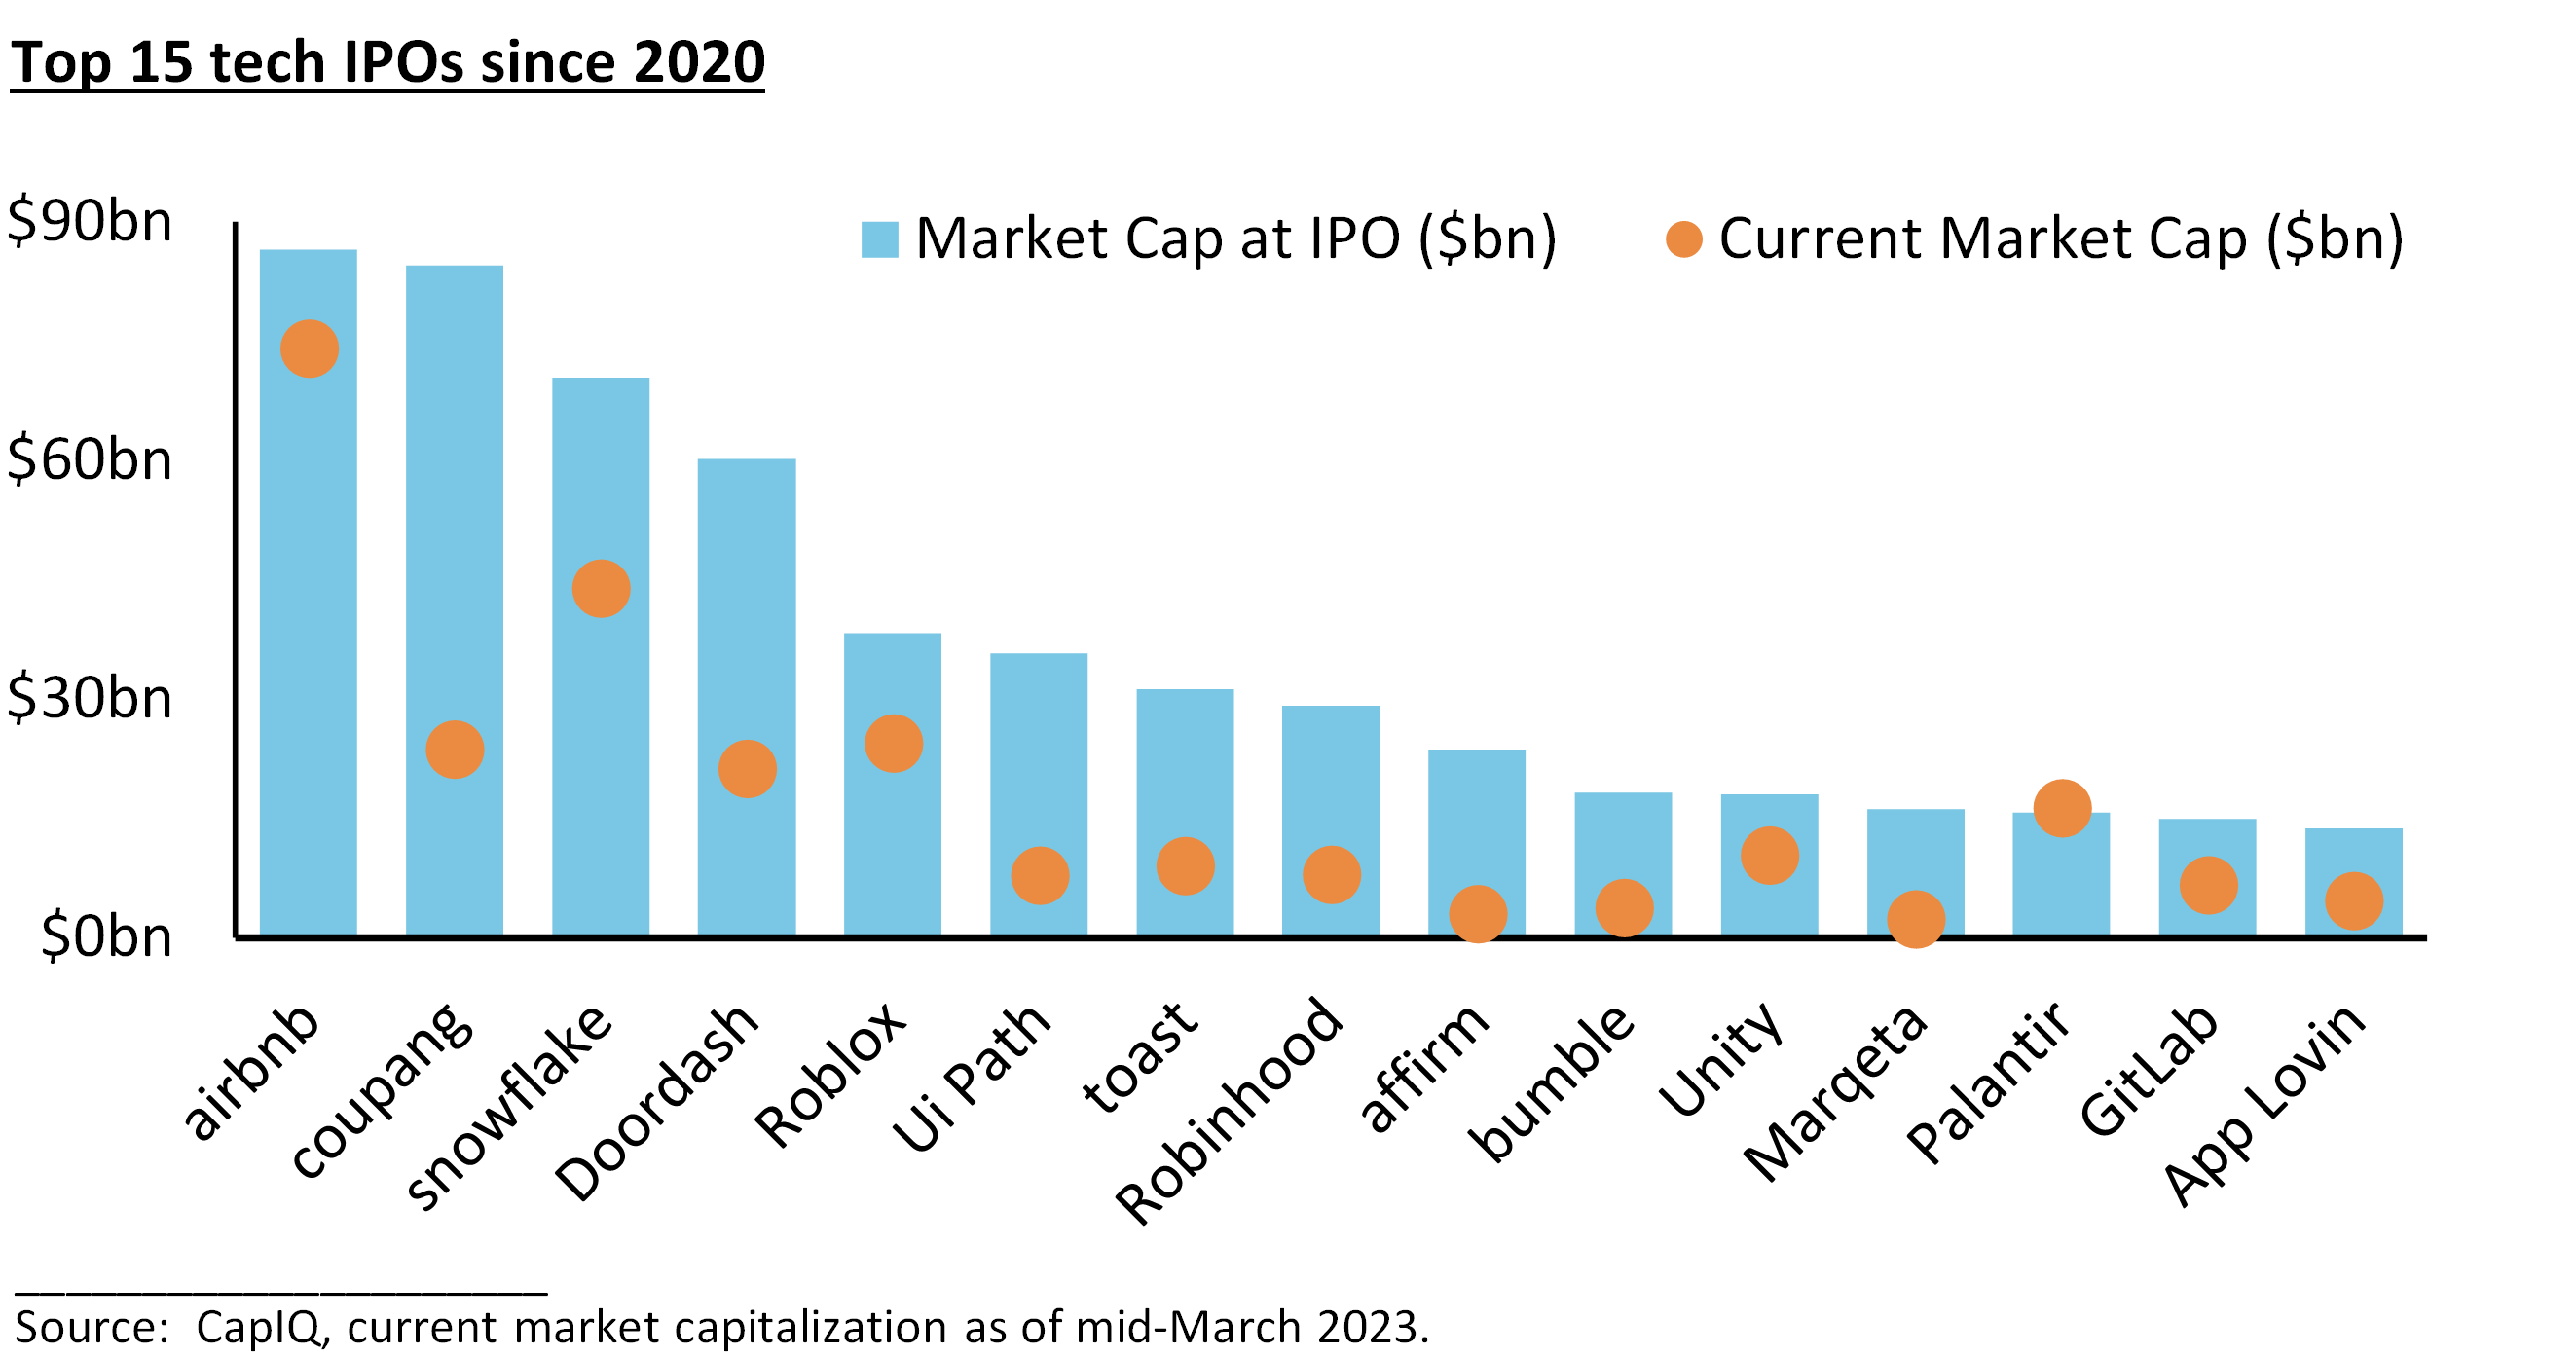
There has been a bifurcation in the impact of the public market software valuation “correction” on loss-making growth stage companies vs. profitable software companies where G+M (revenue growth + operating margin) is the key metric. For some VC (venture capital) backed companies, stakes that were bought at, for example, a $6bn valuation in 2021 are now worth $600m (90% fall), while highly defensible software companies with 40%+ G+M (“rule of 40”) that were, for example, valued at 10x ARR in 2021 might now be 7x ARR (30% fall). VC portfolio companies planning an IPO exit will follow public valuations closely given most of the recent top tech IPOs are trading below their market cap at IPO.
Many VC companies will be reluctant to do a funding round in 2023 at a significantly lower valuation than in 2021, which would dilute the value of the shareholdings of existing investors. VC companies are therefore using their current cash reserves more carefully and reprioritizing their goals from maximizing revenue growth to delivering profitability (becoming breakeven sooner rather than later). However, we are expecting significant down-rounds across numerous VC backed companies that do not have enough cash reserves and need to raise capital in 2023.
SaaS is a sticky recurring revenue business model, but this macro environment is differentiating the “best from the rest”
SaaS (software as a service) companies have benefitted from some of the highest public and private M&A valuations in recent years. In the environment of declining economic growth and high inflation since H2 2021, top quartile SaaS companies that have mission-critical solutions have seen their customers continue their subscriptions and potentially add new products. This low churn and highly predictable cash flow allow these SaaS companies to invest in future growth. However, bottom quartile SaaS providers are seeing their customers cutting costs by cancelling their subscriptions, leading to higher churn and workforce reductions, making it more difficult to win new business.
For “rule of 40” software companies, a regression analysis shows that valuations favored “growth at nearly all costs”, but not anymore. Growth is still more correlated with higher valuation multiples than profitability, but one year ago for publicly listed SaaS companies, the market valued growth 4x more important than profitability, while now it is 2x.
Increasing bifurcation between “top quartile” and cyclical assets in low volume M&A environment
In 2021, potential buyers often had an angle and competed due diligence work upfront to justify their high valuation and submit a binding offer ahead of competing bidders to win auction processes for the best companies. In Q1 2023, there remains a similar buyer appetite to 2021 for “top quartile” assets, aided by their scarcity value in today’s low volume M&A environment. However, there are often differences, some of which are noted below:
- More thorough due diligence – time, resources and capital (dry powder, cash on balance sheet) available at potential buyers to evaluate M&A opportunities at a deeper level in 2023 than in 2021 when activity peaked.
- Assess inflation / supply chain resilience – competitive advantage gives company pricing power – an ability to increase prices as inflation rises and avoid price declines as supplier costs (supply chain issues) normalize.
- Higher scrutiny on add-backs to EBITDA – bidders are less likely to accept aggressive or unsubstantiated “add-backs” (difference between a target’s reported and adjusted EBITDA) in 2023 than in 2021, thereby applying a similarly high valuation multiple (for a specific subsector) to potentially a lower EBITDA figure.
Companies that are relatively cyclical have generally not been coming to market in recent months. For example, the share of consumer companies in European mid-market PE investments has dropped to 6% in YTD 2023, down from its peak of a 33% share in 2015 and its prior low of 15% in H2 2022. Where vendors of cyclical assets have launched an M&A process, many have not consummated due to lack of buyer interest / bids at valuation levels acceptable to sellers.
Stalemate cannot last for PE – GPs need to distribute capital back to LPs and deploy dry powder
Over the last 6 months, we have seen an M&A backlog that is “piling up” without a corresponding level of consummated deals. Many PE vendors are watching out for inflection points for the macroeconomic outlook and public equity and debt markets before launching these processes. However, with the added turbulence from key institutions in the US and European banking sector in March 2023, we expect the uncertain macro environment to continue for some time. GPs (general partners) can only sit on the sidelines for so long before they have to distribute capital back to LPs (limited partners) and deploy dry powder, which is still at record levels. We therefore expect PE firms to:
- Optimize their portfolios in each fund – this could include full or partial exits of “top quartile” companies to return funds to LPs as well as divestitures of just a division of a certain portfolio company, especially if there is strategic buyer interest for that particular part of the business.
- Engage in more buy-and-build activity – buy-and-build could be a higher proportion of dry powder deployment for PE firms, even as their funds keep getting larger. In today’s valuation environment, they could also benefit from significant multiple arbitrage in the vast majority of cases when making add-on acquisitions.
- Higher return from PE vintages during economic downturns – experienced PE professionals have generally reflected on prior downturns wishing in hindsight that they had invested more.
- Wait and launch with higher EBITDA – as PE vendors are typically more focused on MOIC (multiple on invested capital) than IRR (internal rate of return), they can launch an exit of their portfolio company at a later date with a higher EBITDA to offset the impact of a lower valuation multiple and achieve their target MOIC.
Process flexibility, creative deal structuring and “give-and-take” to agree an M&A deal
“Market corrections” are common and normal course for valuations of public stock markets, but are less common in private M&A markets where valuation levels tend to move in smaller increments. Valuations from potential bidders have reduced more than seller valuation expectations, creating a meaningful “bid-ask spread” since Q4 2022.
However, the enterprise value (or valuation multiple) is one component of a transaction – others include process, structure, terms and deliverability which can drive confidence and certainty for the buyer and seller. For example, we have seen deal structures that help to bridge “funding gaps” through seller rollover, reinvestment or a vendor loan.
We may see relatively muted global M&A activity in Q2 2023 as global economic uncertainty persists, and valuation “testing” continues between buyers and sellers. However, the M&A market is open and quality assets are receiving significant buyer attention. Once more clarity exists regarding the macro outlook and banking sector, we expect buyers and sellers will better adjust to the new interest rate environment and more closely align their valuation expectations in M&A processes.
Contact a member of our Global Mergers & Acquisitions team to discuss in further detail.
Appendix
Selected points to note when comparing publicly listed company valuations and private M&A valuations
|
|
|||
|
|
|
||