
2023 Midyear Market Outlook
We talk with the experts at Strategas, a Baird Company, on what’s in store for the U.S. market and economy for the remainder of 2023 and beyond.
The first six months of 2023 saw its fair share of challenges – some broadly anticipated, like the debt ceiling turmoil, and some off many people’s radars, like a sudden banking crisis. Despite it all, the market persevered, with the S&P 500 finishing the first half of the year with a total return topping 16%. We checked in with the policy and macroeconomic experts at Strategas, a Baird Company, on how the first half’s rosy market performance might impact inflation, interest rates and more for the remainder of 2023.
Will Inflation Continue To Fall?
Inflation tends to rise and fall in symmetry: The faster it’s gone up (historically), the faster it’s come back down. It took 16 months for the current wave of inflation to reach its peak, rising from 2% in February 2021 to 9% in June 2022. Since then, though, it has reversed direction considerably – down to 3% for June 2023, the lowest inflation reading in more than two years.
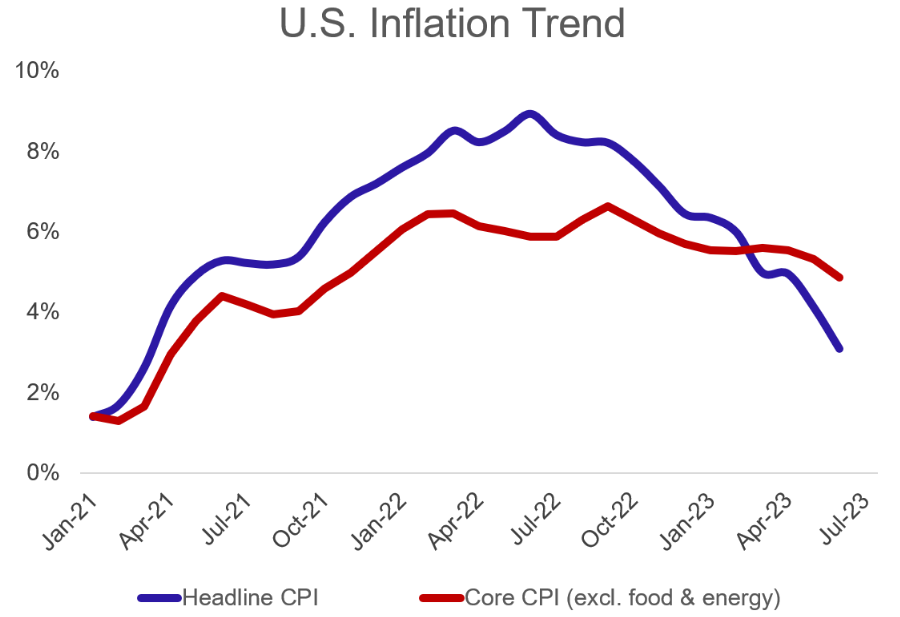
The U.S. Consumer Price Index, which tracks the change in prices for goods and services over time, suggests that the current round of inflation peaked in June 2022. Source: Strategas.
Will inflation continue to decrease and reach The Fed’s stated goal of 2%? It’s difficult to say, but there are headwinds that might make that slightly elevated 3% interest rate more “sticky.” Inflation in housing (both home prices and rent), wages and certain sectors, like apparel, remains elevated, propping up interest rates.
Will the Fall in Inflation Translate to Lower Interest Rates?
While the decrease in inflation over the past 13 months is a positive sign for U.S. consumers, it would be premature to expect an end to the current round of rate hikes. Federal Reserve Governor Christopher Waller noted “this is welcome news, but one data point does not make a trend,” as part of announcing his expectation of two additional 25 basis-point hikes in the second half of 2023.
Part of the reluctance to ease rate hikes is the experience of Fed policy from the 1970s. Inflation looked like it peaked in the early 1970s at roughly 6% before receding in 1973 … only to rebound to roughly 12% in 1975. That came down quickly in 1976 … only to rebound again to nearly 14% in 1980. Given that the S&P 500 barely budged over the course of that decade, it’s easy to understand The Fed’s reluctance to declare victory too soon. We expect they will stop raising rates somewhere in between 5.0% to 5.5%, but then hold that rate for an extended period of time to try to keep inflation anchored.
How Do We Make Sense of the Yield Curve?
At its essence, the yield curve inverts when the interest yield on shorter-term Treasurys is greater than that on longer-term Treasurys. It’s a signal of potential economic weakness on the horizon, one the Federal Reserve typically might counter by cutting rates. There are limits to its usefulness – it doesn’t tell you when we might fall into recession or how severe or lengthy the recession might be – but an inverted yield curve has accurately foreshadowed all 10 recessions since 1955.
Currently the differences between the 10-year Treasury rate and the 3-month, 1-year and 2-year Treasury rate are all negative (“inverted”).
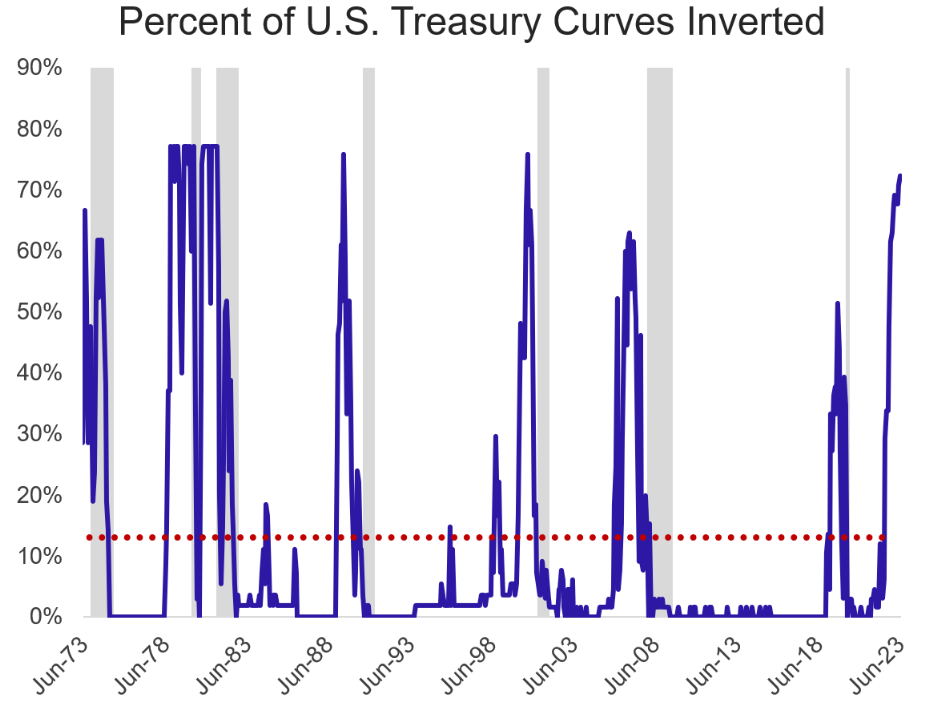
Historically, an inverted yield curve (in blue) has strongly been correlated with a coming recession (in gray) – and the more extreme the inversion, the stronger the correlation. Currently, nearly the entire yield curve is inverted. Source: Strategas
It's easy to see the conundrum The Fed finds itself in: A yield curve this inverted warns of a coming recession, but lowering interest rates to try to spur demand would invite another spike in inflation. Neither is an appealing option.
Is a Recession Still Likely?
Many market prognosticators have declared the likelihood for a recession is now remote, but we’re not so sure. For certain, the surprising economic resilience on display the past few months has pushed back calls for a recession in the near term. Perhaps the biggest sign of economic strength is a robust labor market: Labor data showed a gain of nearly 500,000 jobs from May to June, and there currently are roughly 10 million open jobs for 6 million unemployed U.S. workers. This outsized demand for workers signals a highly productive economy, at least in the short term. Other data lending support to U.S. economic resilience include rising consumer sentiment, a decrease in jobless claims, increases in housing and vehicle sales and strong manufacturing construction data.
However, when you look at the broader economy, the picture becomes more muddled. Small business surveys suggest that job openings will come down – a trend spurred on by a less favorable lending environment following the banking crisis. The U.S. Manufacturing Purchasing Managers Index, a measure of the health of the manufacturing sector, hit a six-month low in June due to inflationary pressure and higher interest rates. U.S. industrial production has started to trend down. All this choppy data, on top of a deeply inverted yield curve, leads us to think we’re not yet out of the recessionary woods.
In its forecast for their June meeting, the Fed announced they expect “a mild recession starting later this year, followed by a moderately paced recovery.” A mild recession in late 2023 or 2024 seems plausible, especially given the cushions built into the economy at the moment, such as leftover cash from COVID-era stimulus and the potential for additional fiscal support should the economy weaken in an election year. But we’d also stress that the odds of recession will remain elevated until there is confidence the sticky inflation we’re experiencing is not going to double- (or triple-) dip.
What Does This Mean for the Stock Market?
It’s absolutely possible we’ve already entered the next bull market, with the S&P 500 posting 25% gains since its recent low in October 2022. But there are four major headwinds remaining that are at odds with a coming U.S. bull market:
- An unemployment rate that has been low for an unusually long period of time and might be poised to start creeping up.
- The likelihood of additional interest rate hikes from an aggressive Federal Reserve determined to clamp down on inflation.
- A sharply inverted yield curve.
- A decrease in U.S. money supply (“M2,” the Federal Reserve’s estimate of the money available in the country, either in cash on hand or in liquid accounts or vehicles like savings accounts or CDs). Too much money in circulation can be inflationary; however, since December, we’ve seen money supply reach unprecedented negative levels. The last time M2 declined even slightly was in 1958 – 16 months before an April 1960 recession.
A choppy U.S. economy is going to create all kinds of positive and negative indicators, which can make it challenging for investors, consumers and business owners to plan for the future. Our best advice is to reach out to your local Baird office and let us help you make sure you’re well-positioned for whatever comes next.