  Download the PDF version Download the PDF version
Baird Advisors Fixed Income Market Commentary
September 2009
|
|
|
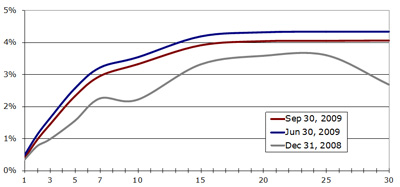
Treasury yields edged 2-13 bps lower in September and fell by as much as 28 bps in the 3rd quarter. While yields are still higher on a year-to-date basis (see chart and table below), the decline in yields during the 3rd quarter reflects 1) the impact of strategically timed Government purchases of Treasury, Government Agency and Agency mortgage pass-through securities, but also 2) a discernable shift from market concern that unprecedented Government stimulus will almost certainly lead to future inflation to renewed concern that deflation may still be the greater risk to the economy and the financial markets in the months and years to come. The Treasury curve flattened modestly during the 3rd quarter (30-yr yield down 28 bps to 4.05%, 2-yr yield down 16 bps to 0.95%) with the difference between 2 and 30-year yields declining to 310 bps from 322 bps on June 30, but still remains considerably steeper than at year end when the 2 to 30-year spread was just 192 bps. |
Treasury Yield Curve Comparison
Source: Bloomberg |
Click for larger view
|
Maturity |
Dec 31, 2008 |
Jun 30, 2009 |
Sep 30, 2009 |
Q3
Change |
YTD Change |
1 |
0.34% |
0.48% |
0.38% |
-0.10 |
0.04 |
2 |
0.76% |
1.11% |
0.95% |
-0.16 |
0.19 |
3 |
0.97% |
1.62% |
1.42% |
-0.20 |
0.45 |
5 |
1.55% |
2.56% |
2.31% |
-0.25 |
0.76 |
10 |
2.21% |
3.53% |
3.31% |
-0.22 |
1.10 |
30 |
2.68% |
4.33% |
4.05% |
-0.28 |
1.37 |
|
Corporate Spreads Tighter on Strong Cash Flows
|
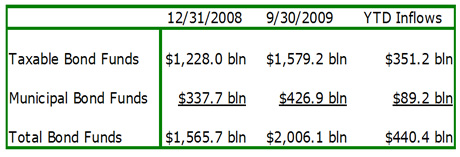
Corporate credit spreads were driven tighter again in September on continued strong cash flow into the bond market. Option adjusted spreads on investment grade corporates declined to 218 bps
(-13 bps in Sep, -88 bps in Q3) while high yield spreads declined to 764 bps (-85 bps in Sep, -181 bps in Q3). Net inflows into taxable bond funds were $26 billion in September with an additional $7 billion flowing into municipal funds. Net inflows of over $440 billion so far this year (see table at right) have been a major factor in the significant tightening of yield spreads in 2009.
|
Mutual Fund Assets
Source: Investment Company Institute
|
Strong 3rd Quarter Returns
|
The 3rd quarter was a great quarter for the bond market (see returns in table below). The decline in yields led to positive returns for Treasuries in September (+0.78%) and the 3rd quarter (+2.10%), but this sector is [the only sector] still negative for the year (-2.29). The tightening of yield spreads led to very strong returns in all non-Treasury sectors. Corporate bonds led all investment grade sectors in the quarter (+8.12%) and are having a very good year (+17.11% YTD). Municipals also had a very strong month (+3.59%) and quarter (+7.12%) and asset-backeds (ABS) followed close behind (+1.87% Sep, +6.30% Q3) and still lead all investment grade sectors so far this year (+23.07% YTD). Agency guaranteed mortgages (MBS) (+0.80% Sep, +2.31% Q3, +5.29% YTD) and direct Gov’t Agency debt issues (+0.69% Sep, +2.02% Q3, 1.99% YTD) chugged ahead and TIPS stayed strong as well (+2.11% Sep, +3.08% Q3, +9.48% YTD) while high yield bonds continue mirror equities (+5.70% Sep, +14.22 Q3, +48.98% YTD).
|
Total Returns of Selected Barclays Capital Indices and Subsectors
|
Index/Sector |
September |
3rd Qtr |
YTD |
| BC Aggregate Index |
1.05% |
3.74% |
5.72% |
| BC Gov’t/Credit Index |
1.14% |
4.16% |
4.74% |
| BC Int. Gov’t/Credit Index |
0.85% |
3.25% |
4.92% |
| BC 1-3 yr. Gov’t/Credit Index |
0.38% |
1.40% |
3.43% |
| US Treasury Sector |
0.78% |
2.10% |
-2.29% |
| Gov’t Agency Sector |
0.69% |
2.02% |
1.99% |
| Corporate Sector |
1.78% |
8.12% |
17.11% |
| MBS Sector |
0.80% |
2.31% |
5.29% |
| ABS Sector |
1.87% |
6.30% |
23.07% |
| High Yield Sector |
5.70% |
14.22% |
49.98% |
| Municipal Sector |
3.59% |
7.12% |
14.00% |
| TIPS |
2.11% |
3.08% |
9.48% |
|
Indices and subsectors are unmanaged and an investment cannot be made directly in an index or a sector . |
