  Download the PDF version Download the PDF version
Baird Advisors Fixed Income Market Commentary
October 2009
|
|
Treasury Yield Curve Steepens Modestly
|
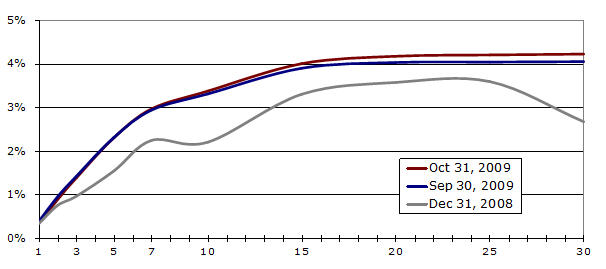
Short –term Treasury yields fell slightly and long-term yields rose slightly in October as signals from the Fed indicated continued commitment to its 0% Fed funds target for the time being. The difference between 2 and 30-year yields increased to 334 bps from 310 bps on September 30 as expectations of imminent Fed tightening faded (see chart and table below). |
Treasury Yields
Source: Bloomberg |
Click for larger view
|
Maturity |
Dec 31, 2008 |
Sep 30, 2009 |
Oct 31, 2009 |
1 mo. change |
YTD Change |
1 |
0.34% |
0.38% |
0.35% |
-0.03 |
0.01 |
2 |
0.76% |
0.95% |
0.89% |
-0.06 |
0.13 |
3 |
0.97% |
1.42% |
1.39% |
-0.03 |
0.42 |
5 |
1.55% |
2.31% |
2.31% |
0.00 |
0.76 |
10 |
2.21% |
3.31% |
3.38% |
0.07 |
1.17 |
30 |
2.68% |
4.05% |
4.23% |
0.18 |
1.55 |
|
Municipals Hit a Wall
|
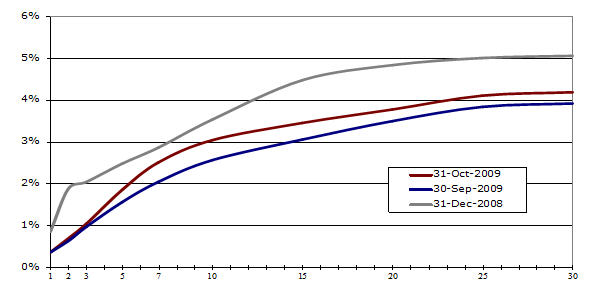
Municipal bonds hit a wall in October as new issue supply of over $50 billion outpaced demand, sending yields higher. The increase in yields was focused on longer maturities with 10-year yields rising by nearly 50 bps. While supply in 2009 ($310 billion YTD) is on pace to exceed 2007’s recent record of $338 billion, 25-35% of this year’s issuance has been Build America Bonds (BABs), which are taxable. The “reduced” supply of true tax exempt issues (i.e. 65-75% of $310 billion) this year coupled with strong demand from investors expecting higher marginal income tax rates in years to come had resulted in steady and strong performance for municipals up until this month. Despite October’s increase, municipals yields are 50-120 bps lower so far this year (see chart and table below).
|
Municipal Yields
Source: Bloomberg
|
Click for larger view
|
Maturity |
Dec 31, 2008 |
Sep 30, 2009 |
Oct 31, 2009 |
1 mo. change |
YTD Change |
1 |
0.85% |
0.37% |
0.37% |
0.00% |
0.00% |
2 |
1.88% |
0.64% |
0.70% |
0.70% |
0.06% |
3 |
2.04% |
0.98% |
1.05% |
1.05% |
0.07% |
5 |
2.48% |
1.57% |
1.86% |
1.86% |
0.29% |
10 |
3.53% |
2.57% |
3.04% |
3.04% |
0.47% |
30 |
5.05% |
3.92% |
4.18% |
4.18% |
0.26% |
|
| |
|
Mixed Returns
|
Despite the set-back for municipals in October (-2.10%), they are still having a very good year (+11.61% YTD) and the rest of the bond market had a good month with all broad based indices posting positive returns. Asset-backeds (ABS) continued to lead investment grade spread sectors with a +1.16% return and have staged an impressive [TALF-fueled] year-to-date rebound of +24.50%. Agency mortgage pass-throughs (MBS, +0.71%) and corporate bonds (+0.70%) benefited from steady investor demand in October and Agency debentures (+0.23%) essentially earned their coupon. The uptick in long-term yields led to slightly negative returns for Treasuries (-0.05%) while demand for long-term inflation protection once again boosted TIPS (+1.23%). High yield rocked on (+1.80%) in the face of flat to negative equity returns, raising concerns that a YTD +51.65% return for this sector may be getting ahead of itself (see October and YTD index and sector returns below).
|
Total Returns of Selected Barclays Capital Indices and Subsectors
|
Index/Sector |
October |
YTD |
| BC Aggregate Index |
0.49% |
6.24% |
| BC Gov’t/Credit Index |
0.24% |
4.99% |
| BC Int. Gov’t/Credit Index |
0.44% |
5.39% |
| BC 1-3 yr. Gov’t/Credit Index |
0.32% |
3.76% |
| US Treasury Sector |
-0.05% |
-2.34% |
| Gov’t Agency Sector |
0.23% |
2.22% |
| Corporate Sector |
0.70% |
17.93% |
| MBS Sector |
0.71% |
6.04% |
| ABS Sector |
1.16% |
24.50% |
| High Yield Sector |
1.80% |
51.65% |
| Municipal Sector |
-2.10% |
11.61% |
| TIPS |
1.23% |
10.82% |
|
Indices and subsectors are unmanaged and an investment cannot be made directly in an index or a sector . |