  Download the PDF version Download the PDF version
Baird Advisors Fixed Income Market Commentary
June 2009
|
|
|
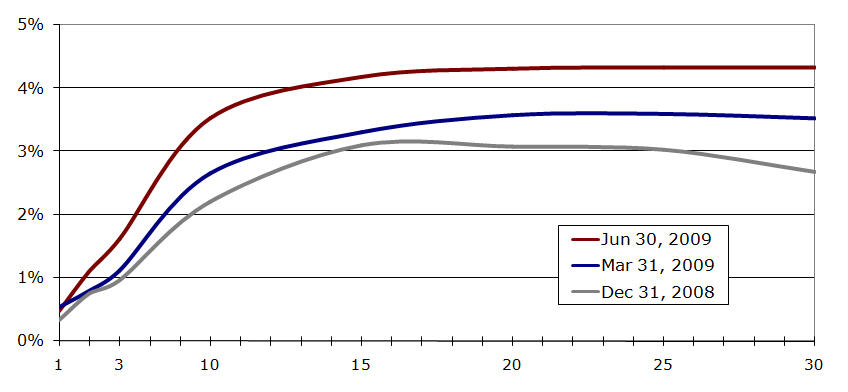
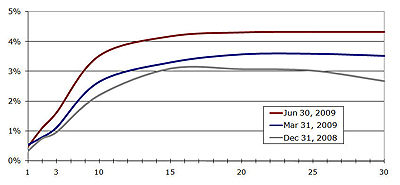
Although Treasury yields finished June very close to where they ended May, they covered a wide range during the month. The 10-year yield rose sharply early in June from a low of 3.46% on May 29 to a peak of 3.95% on June 10 as concerns were building that foreigners would be scaling back purchases of Treasuries. After some reassuring words from China that its reserve policy had not changed and some well-timed open market purchases by the US Treasury, yields tumbled in the back half of June with the 10-year settling at 3.53% on June 30 (up just 7 bps). For the 2nd quarter, heavy new supply pushed yields higher by as much as 90 bps and longer-term inflation concerns caused the yield curve to steepen. The difference between 2 and 30-year Treasury yields rose to 322 bps on June 30 from 273 bps on March 31 and 192 bps on December 31 (see chart and table below). |
Treasury Yield Curve Comparison
Source: Bloomberg |
Click for larger view
|
Maturity |
Dec 31, 2008 |
Mar 31, 2009 |
Jun 30, 2009 |
Q2 change |
YTD Change |
1 |
0.34% |
0.54% |
0.48% |
-0.06 |
0.14 |
2 |
0.76% |
0.80% |
1.11% |
0.31 |
0.35 |
3 |
0.97% |
1.12% |
1.62% |
.0.50 |
0.65 |
5 |
1.55% |
1.66% |
2.56% |
0.90 |
1.01 |
10 |
2.21% |
2.66% |
3.53% |
0.87 |
1.32 |
30 |
2.68% |
3.53% |
4.33% |
0.80 |
1.65 |
|
Spreads Tighten
|
Yield spreads tightened sharply during the quarter (see table at right) as investors continued to find value in non-Treasury sectors. While the tightening this quarter (and year) has been impressive, yield spreads in most sectors are still [considerably] wider than they were at the end of 2007, reflecting both the still limited market liquidity now and further relative return potential moving forward. The two exceptions are Gov’t Agency issues and Agency guaranteed MBS where 6/30 spreads (yellow highlight) are below 12/31/07 levels. We see limited relative value in these sectors at this time.
|
Option-Adjusted Spreads (in bps)
|
12/31/2008 |
3/31/2009 |
6/30/2009 |
12/31/2007 |
| U.S. Aggregate Index |
213 |
187 |
107 |
91 |
| U.S. Agency (non-mortgage)
Sector |
93 |
78 |
41 |
43 |
| Mortgage and ABS Sectors |
|
|
|
Mortgage-Backed Securities |
145 |
102 |
36 |
87 |
|
Asset-Backed Securities |
955 |
706 |
344 |
242 |
|
CMBS |
1010 |
1049 |
763 |
170 |
| Credit Sectors |
|
|
| U.S.
Investment Grade |
493 |
543 |
306 |
181 |
|
Industrial |
500 |
422 |
244 |
181 |
|
Utility |
537 |
440 |
263 |
189 |
|
Financial Institutions |
629 |
769 |
425 |
220 |
| U.S.
High Yield |
1669 |
1514 |
945 |
569 |
Source: Barclays Capital |
A Tale of Two Markets
|
The increase in yields led to negative returns for Treasuries again in the 2nd quarter (-3.02%) giving this sector a tough year so far (-4.30% YTD). Non-Treasury sectors, however, continued to rebound with solid to strong positive results across the board in the 2nd quarter and the first half of 2009. Corporate bonds led all investment grade sectors in the quarter (+10.45%) and managed to return to positive territory for the year (+8.32% YTD). Asset-backeds (ABS) followed close behind with another strong quarter (+7.64%) and lead all investment grade sectors so far this year (+15.78% YTD). Brewing concerns about a changing landscape in municipal credit (e.g. CA) began to weigh on municipal returns in June (-0.94%), but strong demand this year from investors anticipating higher marginal tax rates continued to generate solid returns (+2.11 Q2, +6.43% YTD). Agency guaranteed mortgages (MBS) continue to generate modest positive returns (+0.12% June, +0.70% Q2, +2.91% YTD) while direct Gov’t Agency debt issues are basically flat (+0.10% Q2, -0.04% YTD). Demand for long-term inflation protection continues to boost TIPS (+2.65% Q2, +6.21% YTD) and high yield bonds (+23.07% Q2, +30.43% YTD) have “out-bounced” equities by an impressive margin (see table below).
|
Total Returns of Selected Barclays Capital Indices and Subsectors
|
Index/Sector |
June |
2nd Qtr |
YTD |
| LB Aggregate Index |
0.57% |
1.78% |
1.90% |
| LB Gov’t/Credit Index |
0.86% |
1.85% |
0.55% |
| LB Int. Gov’t/Credit Index |
0.47% |
1.67% |
1.62% |
| LB 1-3 yr. Gov’t/Credit Index |
0.17% |
1.43% |
2.00% |
| US Treasury Sector |
-0.21% |
-3.02% |
-4.30% |
| Gov’t Agency Sector |
0.16% |
0.10% |
-0.04% |
| Corporate Sector |
2.73% |
10.45% |
8.32% |
| MBS Sector |
0.12% |
0.70% |
2.91% |
| ABS Sector |
0.77% |
7.64% |
15.78% |
| High Yield Sector |
2.86% |
23.07% |
30.43% |
| Municipal Sector |
-0.94% |
2.11% |
6.43% |
| TIPS |
0.46% |
2.65% |
6.21% |
|
Indices and subsectors are unmanaged and an investment cannot be made directly in an index or a sector . |