|
|
|||||||||||||||||||||||||||||||||||||||||||
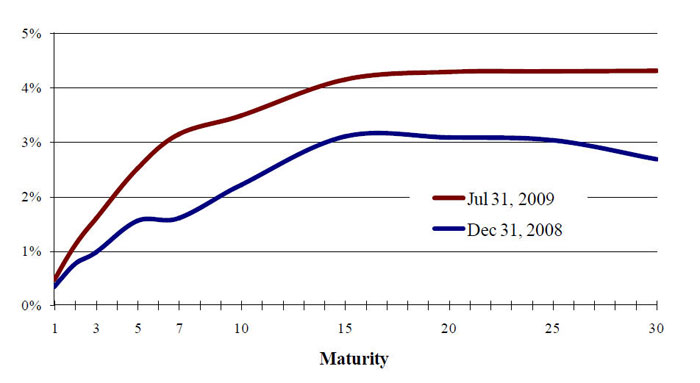
Treasury yields were volatile again in July (10-yr. yield ranged from a low of 3.30% on July 10 to a high of 3.72% on July 27) but as in June, finished the month nearly unchanged from where they started (e.g. 2-yr. unchanged at 1.11%, 10-yr. 3.48% vs. 3.53% on June 30). Mixed economic signals were behind the intra-month volatility, but the ongoing tug-of-war between heavy Treasury issuance ($100+ billion per month) and surprisingly strong demand (encouraged by Government purchases) was also a factor. So far this year, supply has outpaced demand, pushing Treasury yields higher, especially out the curve (see chart and table below). |
|||||||||||||||||||||||||||||||||||||||||||
Treasury Yield Curve Comparison Source: Bloomberg |
|||||||||||||||||||||||||||||||||||||||||||
|
|||||||||||||||||||||||||||||||||||||||||||
| Municipals Tighten vs Treasuries
|
|||||||||||||||||||||||||||||||||||||||||||
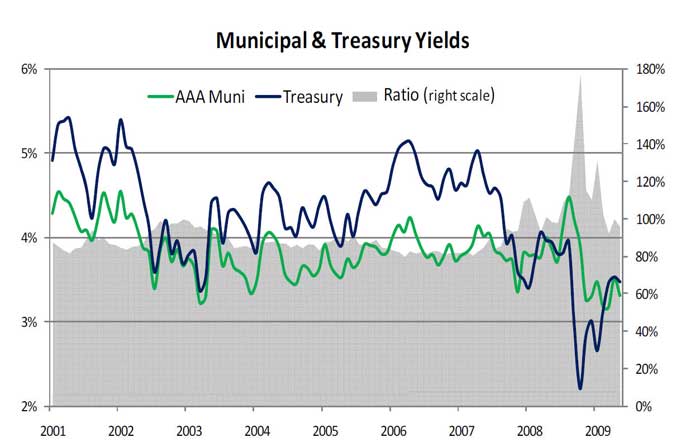
After trading historically “cheap” to Treasuries for much of the last 18 months, municipals are returning to “fair value”. In contrast to Treasury yields, municipal yields have fallen in 2009 (see 10-yr. yield comparison at right) and the ratio of AAA-rated municipal yields to Treasury yields in the 10-yr. range has once again fallen below 100% (shaded portion of graph). High quality short-term municipals actually look “rich” by historical standards with ratios in the 3-yr. range approaching 60%. Strong demand from investors in search of yield has also been more beneficial to lower quality issues; BBB-rated munis have returned 17.03% YTD through July compared to 6.06% for AAA-rated issues. While the market has embraced lower quality issues, we believe there is a changing landscape in municipal credit and encourage caution on lower rated issues at this juncture. |
|
||||||||||||||||||||||||||||||||||||||||||
| Strong Returns
|
|||||||||||||||||||||||||||||||||||||||||||
Strong investor demand translated into strong returns for the entire bond market in July. Corporate bonds led all investment grade sectors with another very strong month (+4.32%) followed by asset-backeds (+1.93%) and municipals (+1.67). Treasuries and Agencies had more modest returns of +0.42% and +0.73% respectively while Agency guaranteed MBS returned +0.82%. High yield bonds continued to experience an equity-like rebound (+6.09% in July, +38.37% YTD) while TIPS marked time in July (+0.07%) as inflation expectations cooled (see table below).
|
|||||||||||||||||||||||||||||||||||||||||||
Indices and subsectors are unmanaged and an investment cannot be made directly in an index or a sector . |
|||||||||||||||||||||||||||||||||||||||||||