
Top Ten Trends in European PE in 2023 and Implications for 2024
The lull in the M&A activity over the last 18 months is soon expected to end as interest rates turn the corner

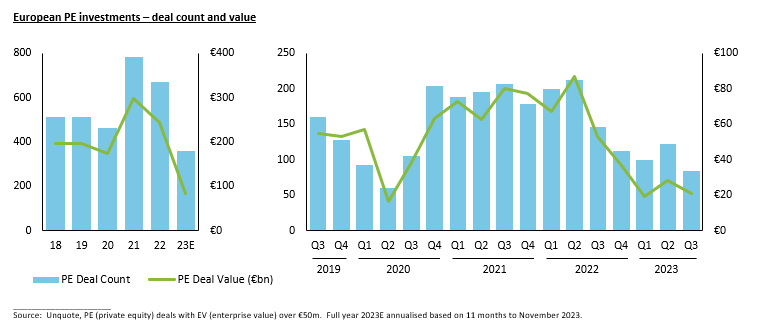
1) 2023 likely to be the trough of this M&A cycle
European private equity (PE) activity (for investments over €50m in enterprise value) has likely reached its trough in 2023 with deal count and value down 45% and 65% respectively compared to 2022. The pent-up supply and demand after an 18 month lull in PE activity has created a substantial M&A pipeline where companies / shareholders have mandated an M&A advisor, but have not yet launched their sale process in the market. Most of these mandates are in the preparation phase, aiming to launch in 2024 assuming company financial performance is on track and improving sentiment around macroeconomic factors such as inflation, interest rates, supply chains and consumer spending.
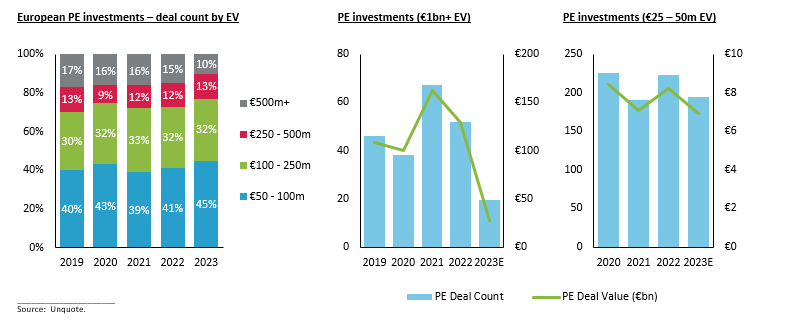
2) Lower mid-market was more resilient in 2023
2023 saw a preference for mid-market PE deals given the relative difficulties in obtaining debt financing for credits with above €50m EBITDA. In particular, the lower mid-market (€25 – 50m EV) was highly resilient with 2023 activity on par with 2021. PE firms often acquired these companies (below €10m EBITDA) with a conservative quantum of debt, in some cases below 3x EBITDA. In the upper mid-market, the share of deals with an EV over €500m fell to 10%.
There were approximately 20 €1bn+ PE investments in 2023, down 60% compared to 2022. However, such deals gained momentum throughout the year with twice as many in H2 than H1 2023, supported by improving private and public debt markets and associated pricing. Multi-billion euro deals in H2 2023 included the sale of founder owned Rosen Group to Partners Group, the fourth buyout of Civica by Blackstone and the P2P (public-to-private) of Adevinta.
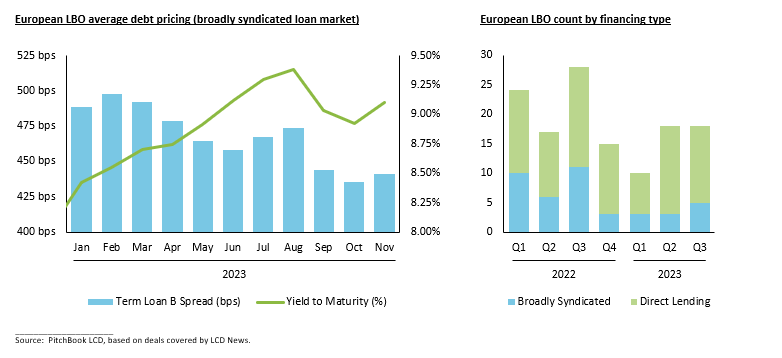
3) Inflation eased in Q4 2023, implying base rates at peak
Inflation in the Eurozone and UK reached 2.4% and 3.9% respectively in November 2023, providing scope for the European Central Bank and Bank of England to lower their base interest rates, currently at 4% and 5.25%, in mid-2024. This backdrop offers stability for the debt markets, which have been increasingly supportive as 2023 has progressed.
Public broadly syndicated deals have been well received in recent months as investor demand exceeded supply for high quality LBOs above €50m EBITDA. LBO term loan B margins are now below 500 bps and OIDs (original issue discount) at 97+ implies EURIBOR yields of ~9%. Sub 400 bps spreads are being seen for well-known credits.
However, we expect bifurcation to continue in 2024 given low lender “hit rates” in M&A processes for credits deemed to have cyclicality. Leverage between debt funds and traditional banks has converged, typically with a differential of 0.5x EBITDA or less. Incumbent lenders continue to be important, and we have seen selective use of portable financing.
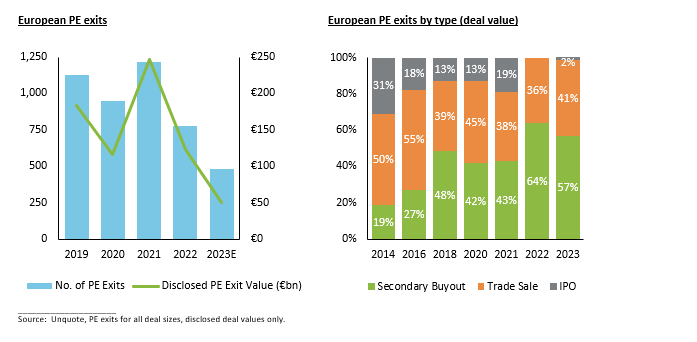
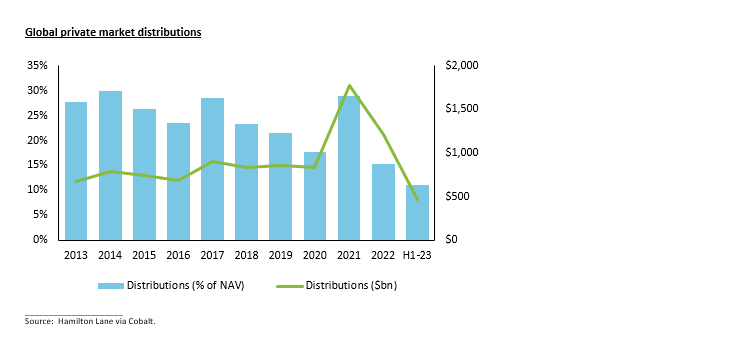
4) Trough in PE exits impacting distributions to LPs
Similar to sponsor deployment, European PE exit activity (for all deal sizes) has likely reached its trough in 2023 with deal count and disclosed deal value down 40% and 60% respectively compared to 2022. As a result, distributions back to LPs have reached a low globally, including Europe. GPs will be under increasing pressure in 2024 to deliver successful exits of portfolio companies or set up continuation vehicles to deliver a partial return on investment. Some LPs could be wary about the overuse of NAV facilities or other “synthetic” forms of DPI (distributed to paid-in capital).
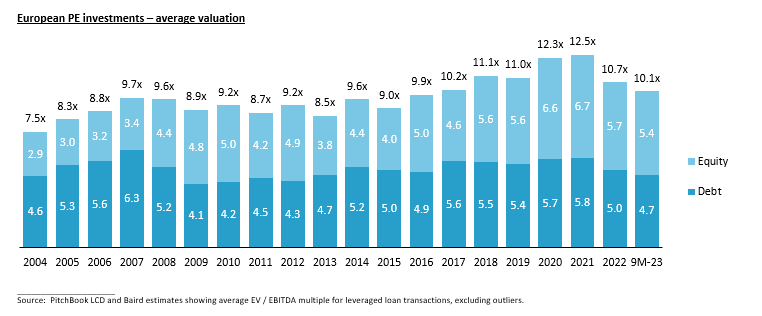
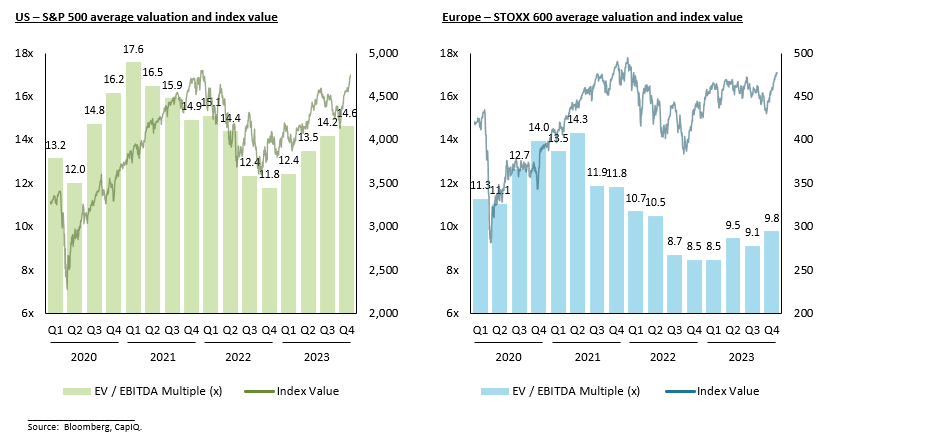
5) Decrease in average LBO valuation levels to 10.1x EBITDA
European LBOs were completed at a lower average valuation in the first 9 months of 2023, reflecting the higher cost of debt financing and closer valuation alignment among buyers and sellers. However, there was still a valuation gap (bid-ask spread) on a number of M&A processes that could not be reconciled, leading to a relatively high proportion of failed deals. Such unconsummated deals were typically for assets with perceived cyclicality or with significant earnings adjustments that created a wide divergence between reported EBITDA and adjusted EBITDA.
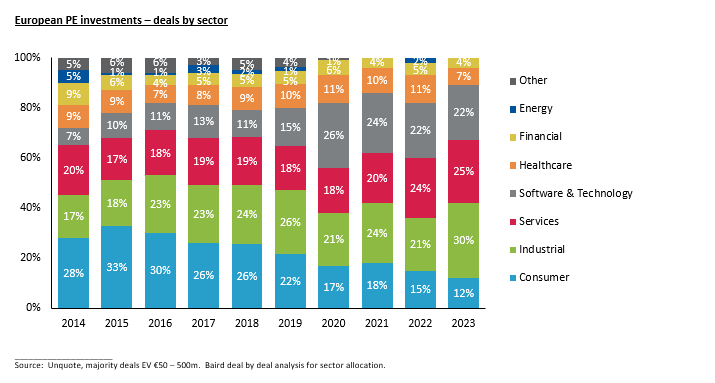
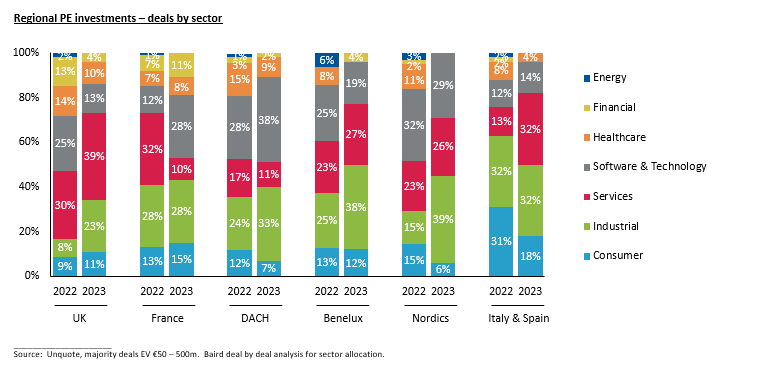
6) Record 77% share of Industrial and Tech & Services activity
Industrial sector activity reached a record high of 30% in 2023 despite Eurozone manufacturing PMI (purchasing managers’ index) being below 50 (indicates contraction) for the last 23 months. There continues to be a divergence of secular growth themes and timings of certain cycles, forming a paradigm in 2024 where end market and application exposures will matter. PE firms, where they are not outbid by strategic buyers, have had considerable success acquiring defensive industrial assets and investing in their growth through digitalisation and / or add-on acquisitions.
The Services sector also accounted for a record share in 2023 with 25% of PE investment activity. Services has seen relatively strong lender appetite against a backdrop of lower average engagement lenders for LBOs in 2023. Software & Technology activity reduced slightly to 22% given the relative drop in public equity valuations for recent SaaS IPOs. Consumer and Healthcare combined contributed their lowest share of PE activity at below 20% in 2023, though we are seeing a ramp-up in pitch activity from sellers in both sectors in Q4 2023 / Q1 2024, following a similar trend in the US.
7) Relative strength of the UK – 27% share highest in a decade
The UK increased its lead as the most active PE investment region in Europe, despite the risk of stagflation during much of 2023. We expect the country will continue its number one position in 2024 given that 23% of the 4,000 European portfolio companies (backed by a sponsor with over $1bn AUM) are based the UK. As a reflection of its broad based strength, the UK saw almost 20 mid-market industrial PE deals across various subsectors.
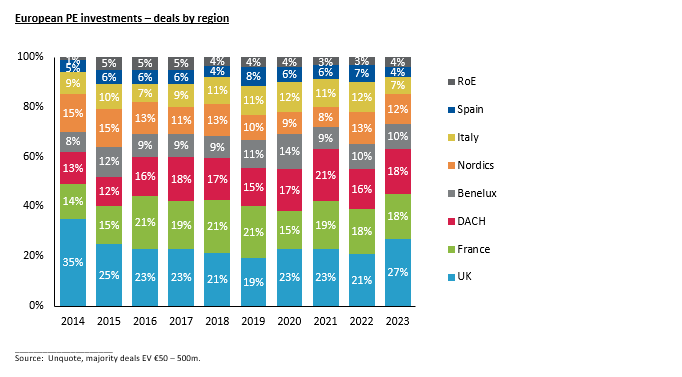
Over 70% of DACH PE investments were in Industrial and Software & Technology, highlighting the depth of the Mittelstand as both a leading exporter of engineered products and a broad customer base for IT solutions. The Nordics saw a similar dynamic with these two sectors representing almost 70% of activity. In 2023, Italy and Spain contributed their lowest share of 11% of European PE activity, and is likely to benefit from a recovery in Consumer M&A in 2024.
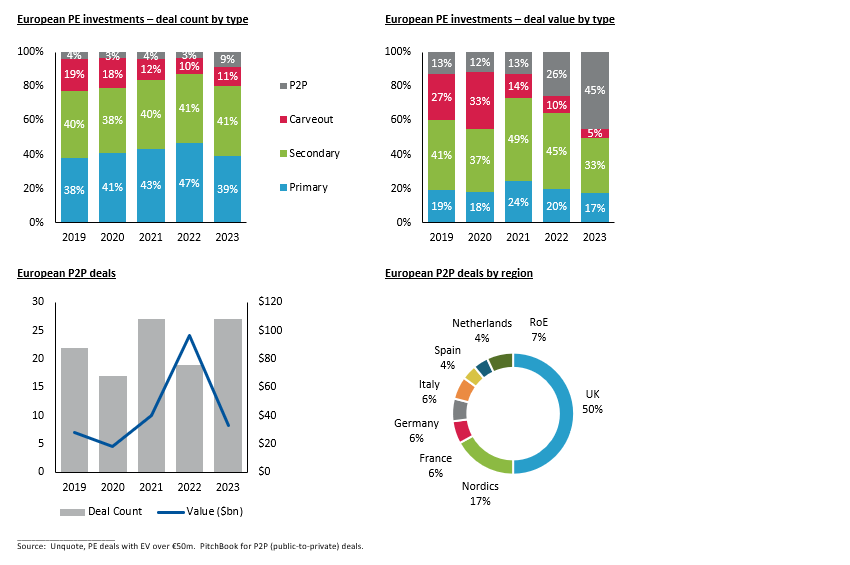
8) P2P accounts for record 45% of PE deal value
Public-to-private (P2P) deals accounted for a record 9% and 45% of deal count and value respectively in Europe in 2023. PE firms were actively scouring the public markets for targets, partially driven by relatively low company valuations on European stock markets with the STOXX 600 averaging a discount of 30% to the S&P 500. There has been particular interest in the London Stock Exchange with UK companies accounting for half of the year’s P2Ps. However, there is still sometimes a gap between the premium that sponsors are willing to pay and what target boards are willing to accept e.g. Apollo’s unsuccessful approaches to both THG plc and John Wood Group plc in H1 2023.
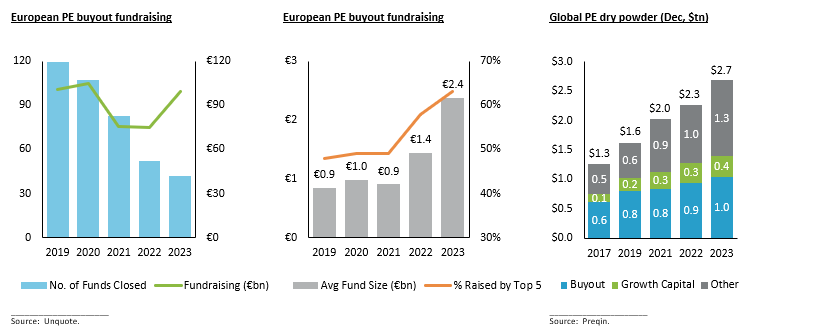
9) PE fundraising skewed towards large-cap sponsors
2023 has been the toughest fundraising market since 2009 for many mid-market PE firms. The liquidity crunch from a lack of exit volumes has driven LPs to be more selective with commitments, focusing on larger well-established GPs with a strong track record. This dynamic has led to a robust €100bn being raised for European based buyout funds in 2023, a record 63% of which went to the top 5 fundraising GPs – CVC Capital Partners IX (€26bn), Permira VIII (€16.7bn), PAI Partners VIII (€7.1bn), KKR European Fund VI ($8bn) and Bain Capital Europe VI (€6.4bn). 2024 will see further pressure to deploy the record $2.7tn of global PE dry powder, of which $1tn is for buyout investments.
10) US M&A momentum is building in Q4 2023 / Q1 2024
The US has seen strong pitch activity since mid-2023 with Baird adding a significant number of new M&A engagements into the backlog in Q3 2023(1). Many of these mandates were in the preparation phase in Q4 2023, aiming to launch in Q1 2024(1). We began to see a ramp-up in European pitch activity in Q4 2023(1), which is continuing in Q1 2024, for M&A processes also aiming to launch in 2024. We expect the European M&A recovery to come, though lagging that of the US. We are enthusiastic about a recovery in PE investment and exit activity in the US and Europe, highlighted by:
- In November 2023(1), Baird announced its highest number of $500m+ M&A deals globally since December 2021
- Recent price tightening in the US and Europe with $1bn+ cheques available in public and private debt markets
- Narrowing valuation gap between buyers and sellers, borne by more realistic valuation expectations from sellers

Contact a member of our European team to discuss these trends in further detail:


1 Select datapoints from Baird Global Investment Banking as of January 2024.
Robert W. Baird Limited is authorised and regulated in the United Kingdom by the Financial Conduct Authority. Robert W. Baird & Co. Incorporated. Member SIPC. Please visit our website at bairdeurope.com or rwbaird.com for important information and disclosures.