  Download the PDF version Download the PDF version
Baird Advisors Fixed Income Market Commentary
May 2009
|
|
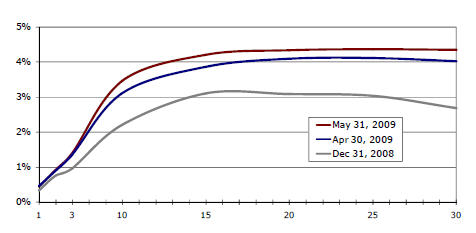
Long Treasury Yields Continue to Rise
|
Treasury yields continued to rise in May as heavy new issuance began to weigh on the bond market. During the month, the Treasury auctioned a stunning $770 billion of T-bills (maturities of less than 1 year) and $172 billion of T-notes and T-bonds (maturities of 2 to 30 years). Amazingly, the market absorbed all the new T-bills with no noticeable impact as 1-year T-bill rates fell by 2 bps in May. However, the increase in longer-term yields (10-year and 30-year yields rose 34 and 31 bps respectively) reflects the market’s concern that heavy supply will push interest rates higher over time. |
Treasury Yield Curve Comparison
Source: Bloomberg |
Click for larger view
|
Maturity |
Dec 31, 2008 |
Apr 30, 2009 |
May 31, 2009 |
1 mo. change |
YTD Change |
1 |
0.34% |
0.45% |
0.44% |
-0.02 |
0.10 |
2 |
0.76% |
0.90% |
0.92% |
0.02 |
0.16 |
3 |
0.97% |
1.36% |
1.40% |
.0.04 |
0.43 |
5 |
1.55% |
2.01% |
2.34% |
0.33 |
0.79 |
10 |
2.21% |
3.12% |
3.46% |
0.34 |
1.25 |
30 |
2.68% |
4.03% |
4.34% |
0.31 |
1.66 |
|
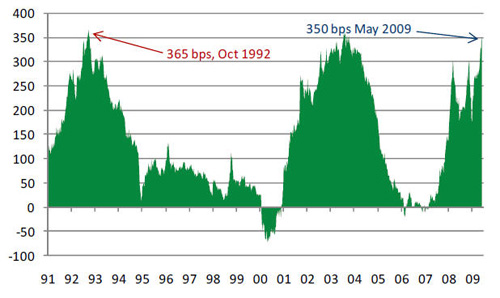
Yield Curve Approaches Record Steepness
|
With the recent increase in long-term Treasury yields, the difference between 2 and 30-year yields (350 bps on May 22) is approaching its all-time high of 365 bps reached in October 1992 (see chart at right). With Fed policy “wide open” for the time being, we believe a steep curve is part of the Government’s plan to aid bank earnings and feel it is likely that the yield curve will steepen further to a new record this year.
|
2 to 30 Year Yield Spread (in bps)
|
Spread Sectors Continue to Rally
|
As Treasuries lost additional ground in May (-1.01%,
-4.10% YTD), non-Treasury sectors continued to rally. Asset-backed securities continued their convincing recovery and led all investment grade sectors with another strong month (+5.43%, +14.90 YTD) followed by investment grade corporates (+3.90%, +5.44% YTD). Steady investor demand pushed municipals higher again in May (+1.06%, 7.43% YTD) and high yield bonds continued an impressive bounce with stocks (+6.73%, +26.80% YTD). Government Agencies (+0.01%, -0.20% YTD) and Agency MBS (+0.29%, +2.79% YTD) took a breather in May as investors favored higher yields over Government guarantees and TIPS advanced further (+2.10%, +5.73% YTD) on concerns that inflation could be the bond market’s next big problem down the road.
| Total Returns of Selected Barclays Capital Indices and Subsectors |
Index/Sector |
May |
2009 YTD |
| BC Aggregate Index |
0.73% |
1.32% |
| BC Gov’t/Credit Index |
0.80% |
-0.30% |
| BC Int. Gov’t/Credit Index |
0.74% |
1.15% |
| BC 1-3 yr. Gov’t/Credit Index |
0.68% |
1.83% |
| US Treasury Sector |
-1.01% |
-4.10% |
| Gov’t Agency Sector |
0.01% |
-0.20% |
| Corporate Sector |
3.90% |
5.44% |
| MBS Sector |
0.29% |
2.79% |
| ABS Sector |
5.43% |
14.90% |
| High Yield Sector |
6.73% |
26.80% |
| Municipal Sector |
1.06% |
7.43% |
| TIPS |
2.10% |
5.73% |
|
Indices and subsectors are unmanaged and an investment cannot be made directly in an index or a sector . |